
Jump to section
- When the Pipeline Goes Dark
- The Four Layers Behind Every SeLoger Request
- DNS and TCP
- TLS and application response
- Running the First Round of Diagnostics
- Reading Results from Multiple Angles
- Matching Symptoms to Likely Root Causes
- Anti-bot enforcement
- Schema drift
- Rate limiting
- Genuine outage
- Building Scraper Resilience Against Anti-Bot Defenses
- A Monitoring Setup That Actually Catches Problems
A SeLoger extraction job can look healthy right up until it stops producing useful data. The scheduler runs, the HTTP client receives a response, and the downstream table fills with nothing. At that point, the urgent question isn’t how to parse another listing. It’s whether SeLoger is unavailable, your exit network is blocked, the response has become a challenge page, or the portal has changed the structure your parser expects.
That distinction matters because SeLoger has evolved through several platform eras, from 3615 SeLoger on Minitel in 1989 to SeLoger.com in 1996 and later ownership changes documented in its company history here. A dependable SeLoger scraper therefore needs incident diagnostics, transport awareness, schema checks, and operational safeguards, not just selectors that work today.
When the Pipeline Goes Dark
At 3 a.m., the alert says that the SeLoger pipeline returned an empty batch. The first instinct is usually to restart the worker. That can make the incident harder to understand, because retries may turn one clear failure into a noisy mixture of blocks, partial responses, and exhausted proxy sessions.
Start with the most recent successful payload timestamp. Then inspect the last few requests before the first empty result. You’re looking for empty bodies, redirects, HTTP 403 responses, rate-limit responses, or a nominally successful response whose body contains a challenge rather than listing data.
Practical rule: “No listings” is an outcome, not a diagnosis.
In production, an empty result usually belongs to one of four branches:
- Local network failure: DNS resolution, routing, connection establishment, or TLS negotiation failed from the worker.
- Rate limiting: SeLoger accepted earlier requests but began slowing or refusing a burst of traffic.
- Anti-bot enforcement: The request reached the portal, but the response contains a CAPTCHA, device check, or incomplete shell.
- Schema change: The server returned content, yet the parser no longer recognizes listing cards, embedded JSON, or expected fields.
The first minute should answer only two questions. Did the request reach SeLoger, and did the response contain the kind of content your parser expects? Those questions are more useful than immediately changing the User-Agent or increasing concurrency.
A good incident record includes the target search, location input, transaction filters, proxy tier, status code, response size, redirect chain, and parser outcome. A canonical search endpoint is especially important because SeLoger extraction commonly begins by resolving a city, postcode, or saved search before traversing result pages. Practical implementations often work with roughly 30 listings per page and an overall ceiling near 300 items in some runs, so an empty or truncated page count can also indicate input normalization or pagination failure, as described in this SeLoger scraper implementation.
Teams that need recurring property feeds should treat this as a service operation, not a one-off crawl. A managed real-estate data collection service can absorb some maintenance burden, but the same diagnostic discipline still applies when an extraction suddenly goes dark.
The Four Layers Behind Every SeLoger Request
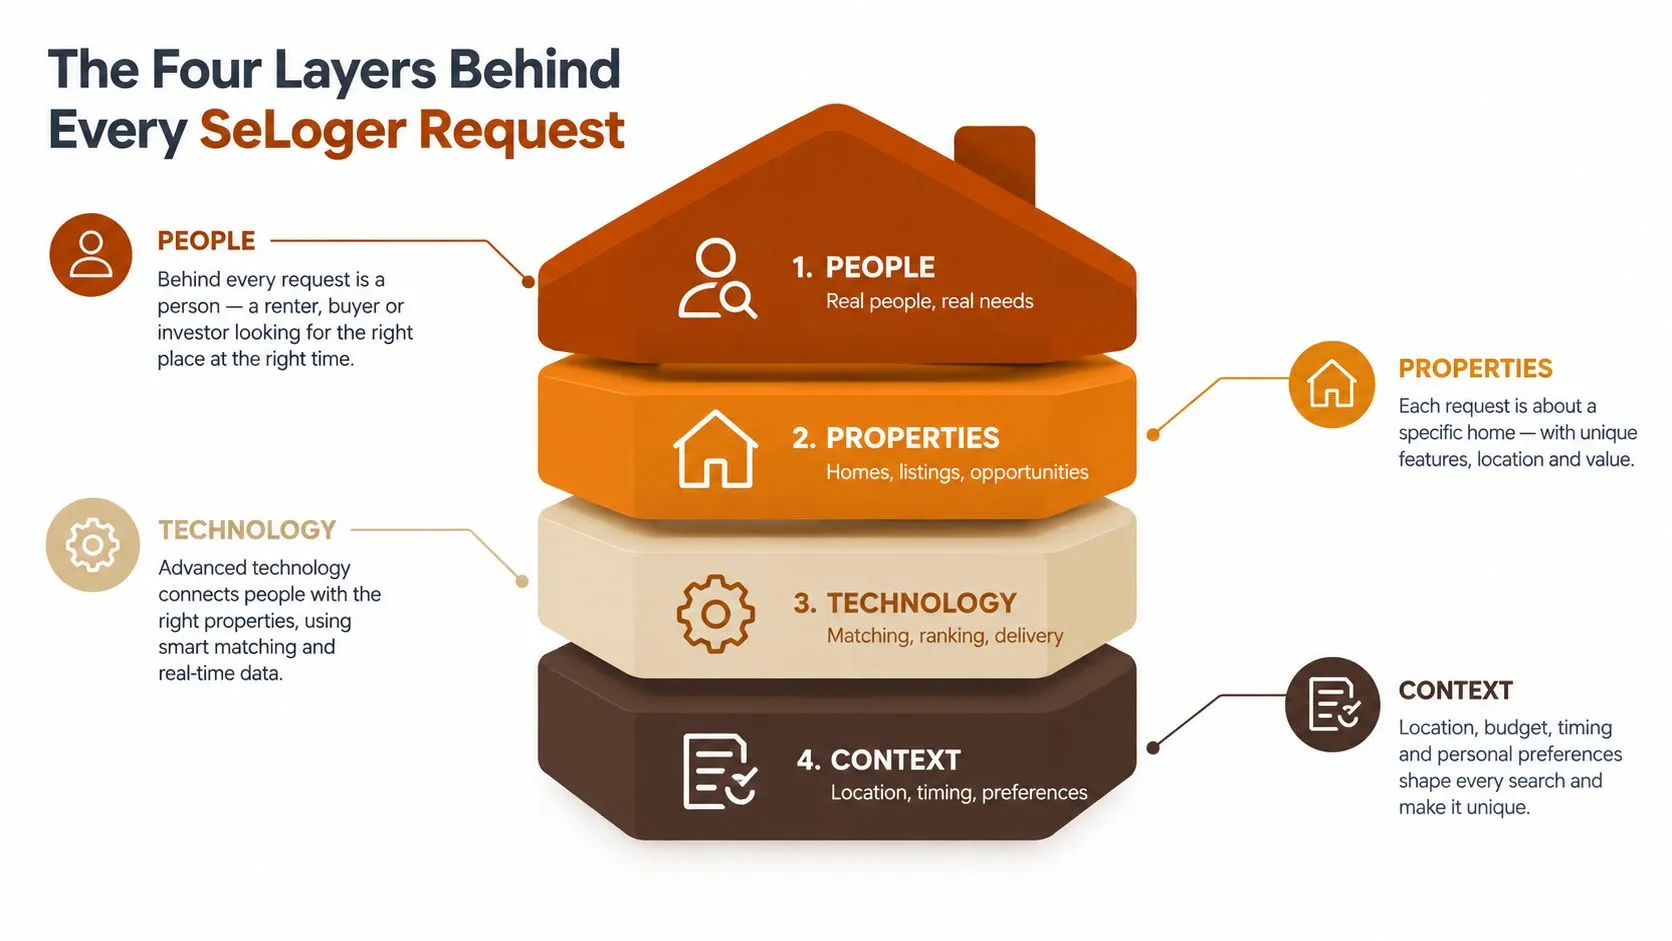
A request to SeLoger is not one event. It is a sequence of observable layers, and each layer narrows the failure domain.
DNS and TCP
DNS is the first check. If the worker can’t resolve the hostname, the problem is local to the resolver path or execution environment. A successful lookup doesn’t prove that SeLoger is reachable, but a failed lookup means application debugging is premature.
TCP tells you whether the connection can reach the remote edge. Timeouts and connection resets point toward routing, firewall policy, exhausted sockets, or an upstream edge rejecting the connection before the application can answer. A connection that completes moves the investigation upward.
TLS and application response
TLS exposes certificate negotiation, SNI handling, protocol support, and the transport fingerprint presented by the client. A valid certificate and successful handshake don’t guarantee access. Anti-bot systems can still classify the client using transport and browser signals.
The application response is where most engineers begin, but status alone is weak evidence. A 200 response can contain a JavaScript shell, a challenge page, or empty embedded JSON. A 403 may indicate a hard block or a browser check. A 503 may be a transient upstream problem, a proxy issue, or a protective response.
When documenting transport behavior, it helps to use the same layered thinking found in other technical verification workflows, including resources that explain how vehicle checks work. The object being checked changes, but the principle is similar: separate the observable stages instead of treating a final “failed” result as a complete explanation.
Record these fields for every diagnostic request:
- Resolution: Did the hostname resolve consistently?
- Connection: Did TCP establish without a timeout or reset?
- Handshake: Did TLS negotiate normally with the expected certificate?
- Content: Was the response a listing document, a challenge, a redirect, or an empty shell?
That evidence is more valuable than a generic “request failed” log. For larger teams, the operational concerns overlap with those described in enterprise web scraping, especially around consistent evidence, ownership, and repeatable recovery.
Running the First Round of Diagnostics
Run diagnostics from the affected worker, not only from a laptop. A local browser may have a different network path, cookies, reputation, and TLS behavior, so it can produce a reassuring result that says little about the production request.
Begin with headers and redirects:
`curl -I -L -A “Mozilla/5.0 (Windows NT 10.0; Win64; x64) AppleWebKit/537.36 Chrome/…”
A healthy response should show a completed redirect chain and a normal final status. A block may appear as a 403, an unexpected redirect, a very small body, or headers associated with a challenge provider. Don’t treat a 200 as success until the body has passed a content check.
Test name resolution separately:
dig +trace seloger.com
You want a complete resolution path from the production environment. If the trace fails before the authoritative answer, investigate the worker’s resolver and network policy. If resolution succeeds but the request still fails, move to the connection and TLS layers.
Check the path:
traceroute seloger.com
mtr --report seloger.com
A consistent failure near the local network suggests an environment problem. Packet loss or a black hole farther along the route can indicate an unstable path, although intermediate routers may also deprioritize diagnostic traffic. Use these commands as supporting evidence, not as proof of an application outage.
Inspect the certificate and negotiated protocol:
openssl s_client -connect seloger.com:443 -servername seloger.com
Look for a certificate chain that matches the requested hostname and a modern negotiated TLS version. A certificate mismatch, handshake failure, or unexpected termination points away from HTML parsing. A successful handshake followed by a challenge page points toward application or anti-bot enforcement.
Create a compact incident record containing:
- Request identity: Canonical search URL, filters, and location input.
- Transport result: DNS, TCP, TLS, and redirect outcomes.
- Content result: Body size, content markers, embedded JSON presence, and parser status.
- Execution context: Worker, proxy tier, session, and time of request.
A lightweight script can run the commands, capture exit codes, and emit a single summary such as “DNS healthy, TLS healthy, HTTP challenge, parser failed.” Keep the raw outputs as artifacts. A short summary accelerates triage, while the full evidence helps identify recurring patterns.
This approach is more useful than collecting generic error labels. The common web scraping errors guide is useful background, but SeLoger incidents still require target-specific body inspection and transport evidence.
Reading Results from Multiple Angles
A single local reproduction can mislead you. SeLoger may serve different content to different IP reputations, autonomous systems, browser profiles, or geographic exits. Your office browser might load listings while the production proxy receives an interstitial, or the reverse.
Use three evidence sources within the same incident window:
- The production host. Capture curl output, browser network logs, full headers, response bodies, and parser metrics. This is the fastest signal for your actual failure, but it inherits the worker’s reputation.
- Independent availability checks. Services such as Downdetector, DownForEveryoneOrJustMe, and Sucuri SiteCheck can show whether other observers see a broad problem. They can’t reliably reveal a targeted rate limit or proxy-specific soft block.
- Browser developer tools. Use a clean incognito session, disable cache, inspect the Network tab, and export a HAR. Compare the document request with the calls that return embedded search data or listing details.
| Source | What It Confirms | What It Misses | Trust When |
|---|---|---|---|
| Production host | Your actual route, proxy, headers, body, and parser result | Whether the portal is broadly unavailable | You need to explain your pipeline’s failure |
| Independent checker | A possible wider availability issue | Targeted blocks, proxy reputation, and soft challenges | Multiple external observers report the same symptom |
| Browser developer tools | Request sequence, JavaScript dependencies, and rendered content | Production proxy behavior | You need to compare a normal browser session with automation |
The strongest diagnosis comes from disagreement. Suppose curl returns 200 with a small shell, an independent checker shows no wider incident, and a French residential proxy returns full listing content. That combination points to fingerprinting or proxy reputation, not a SeLoger outage.
Log the discrepancy instead of flattening it into “SeLoger was down.” Over time, these comparisons reveal whether a specific proxy tier fails, whether only search endpoints are affected, or whether a redesign changed the browser request sequence. That history becomes the basis for routing decisions and alert thresholds.
Matching Symptoms to Likely Root Causes
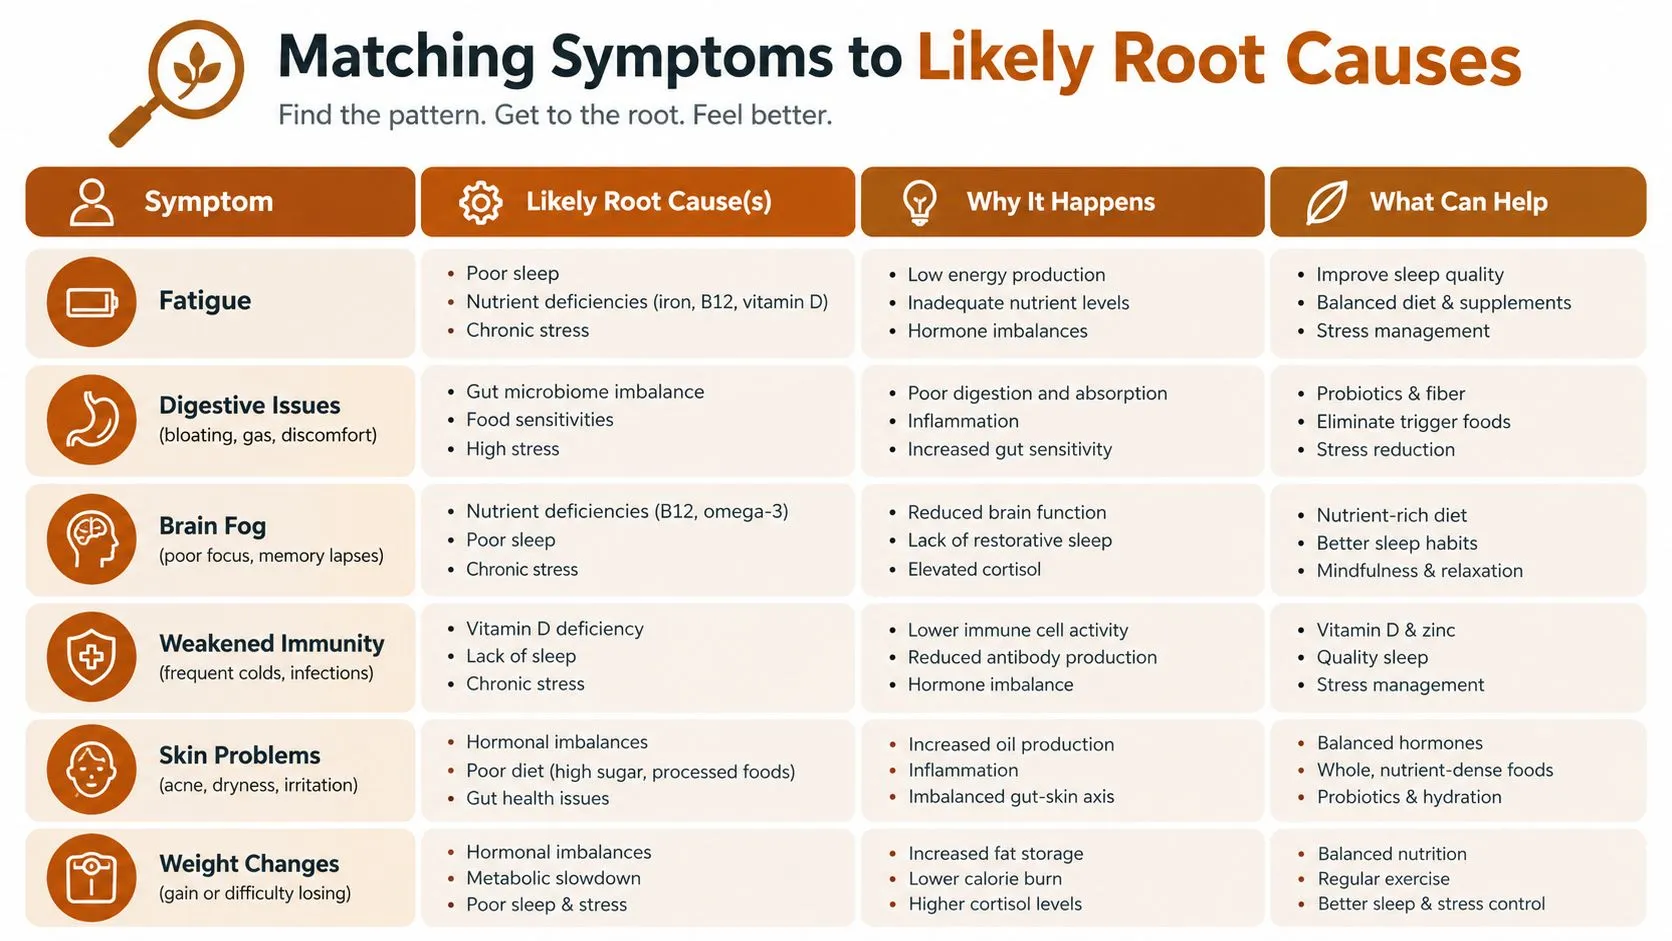
The useful probability tree starts with the response body, not the status code. For SeLoger workloads, anti-bot friction is usually the first branch to test, followed by parser drift during a redesign, rate limiting, and finally a genuine portal-wide outage. This is an operational ranking, not a published statistic.
Anti-bot enforcement
A 200 response with a CAPTCHA marker, missing listing tiles, or an empty JSON object strongly suggests that the request reached a protective layer. A 403 with a device-check or challenge body leads to the same branch. Test from another proxy tier and compare the complete body, not just the status.
Schema drift
If HTTP remains 200, response sizes look normal, and parser exceptions suddenly appear, inspect the document and embedded JSON. Changed keys, relocated state objects, altered CSS classes, or a new rendering path can break a selector without affecting transport.
Rate limiting
A 429, a Retry-After header, or failures that begin after a burst of postcode queries point toward throttling. Reduce concurrency, preserve session locality, and check whether the same search succeeds after a controlled pause. Replaying the same burst usually adds evidence against your own proxy pool.
Genuine outage
Treat an outage as the least specific branch until independent evidence supports it. Multiple networks failing, broad availability monitors reporting impact, and TLS errors across unrelated proxy tiers are stronger indicators than one worker returning 503.
Decision rule: If content is a challenge, investigate identity and transport. If content is valid but parsing fails, investigate schema. If requests fail after traffic bursts, investigate pacing. If unrelated networks fail, investigate availability.
The public discussion of bypassing IP bans in web scraping can help frame proxy symptoms, but don’t respond to every 403 by rotating blindly. A block may be tied to browser execution, session continuity, geography, or a specific endpoint, and indiscriminate rotation can destroy the evidence needed to isolate it.
Building Scraper Resilience Against Anti-Bot Defenses
Once the evidence points to anti-bot enforcement, more retries won’t fix the underlying mismatch. SeLoger is widely treated as a high-friction target. Public scraper documentation recommends French residential proxies and JavaScript rendering, while one implementation describes rotating French residential IPs, TLS fingerprint spoofing, and browser emulation as part of its approach in its SeLoger scraping documentation.
Start with geography and session design. A French residential exit is more plausible for French property research than a generic datacenter route, but rotation should preserve enough session continuity for cookies and browsing state to remain coherent. Constantly changing the exit during one search can look less realistic than a stable session with controlled movement.
Use browser rendering only where the response requires it. If the search page already exposes structured data through a stable HTTP response, keep that path lightweight. If the server returns a JavaScript shell or the listing content appears only after execution, escalate that endpoint to a maintained browser context with realistic viewport and navigation behavior.
Treat retries as a control loop:
- Back off after rate limits: Add exponential delay and jitter rather than replaying requests at fixed intervals.
- Open a circuit: Pause a failing proxy tier when its errors rise, so the whole queue doesn’t amplify the block.
- Preserve evidence: Store status, body markers, response size, and proxy identity before retrying.
- Validate content: Fetch a known listing and confirm that expected fields parse successfully.
A schema-aware health check matters more than an HTTP check. A page can return 200 while delivering a challenge or a redesigned shell. The guide to anti-bot measures in Playwright provides useful context for browser-side controls, but browser automation should remain an escalation path rather than the default for every page.
There is also a cost decision. Building your own proxy, browser, retry, and monitoring stack gives control but creates maintenance work. Buying an extraction service can reduce that burden, much as teams compare building versus buying price data collection, but vendor claims still need validation against your target, fields, geography, and delivery schedule.
A Monitoring Setup That Actually Catches Problems
Monitoring should detect unusable data, not merely failed HTTP requests. A practical setup probes the homepage, a canonical search, and a known listing URL from the same execution context used by the production pipeline. Run those probes on a regular cadence, and keep the response body long enough to compare it with a known-good schema.
A useful checklist has four layers:
- Synthetic availability: Confirm that the target resolves, connects, negotiates TLS, and returns a response.
- Content validity: Confirm that listing cards, price fields, identifiers, and embedded state can be parsed. Flag CAPTCHA markers and empty shells.
- Latency and errors: Track status distribution, request duration, parser failures, and listing yield against a rolling baseline.
- Proxy health: Separate exit-node failures from portal-wide failures. A bad proxy must not page the team for an outage that affects only one route.
A single 503 is usually noise. Repeated 403s from the same proxy tier are a signal, especially when another tier succeeds. A sustained drop in listing yield below the normal baseline deserves investigation even when status codes remain healthy.
Set warning and paging policies from observed baseline behavior rather than copying thresholds from another workload. A warning can go to Slack when one proxy group degrades or a parser sees an unfamiliar field. PagerDuty should be reserved for sustained content failure across independent routes, a broken schema check on the known listing, or a delivery condition that threatens the downstream SLA.
An AI SEO tool blog can provide broader ideas for content and search monitoring, but SeLoger operations need domain-specific checks. The monitor must know what a valid property record looks like, which fields are essential, and when an empty feed is operationally dangerous.
The final alert should tell the on-call engineer what changed: “search response is a challenge,” “known listing no longer parses,” or “only proxy tier affected.” That message turns a 3 a.m. page into a decision instead of a scavenger hunt.
WebscrapingHQ provides managed real estate extraction, custom schemas, recurring feeds, monitoring, retries, and proxy management for teams that need SeLoger data without owning every maintenance task. If your current scraper fails on empty results, proxy blocks, or portal redesigns, review the workflow with WebscrapingHQ and define the fields, schedule, and recovery expectations before the next incident.
Want this done for you?
Send us the URLs. We'll quote it in 24 hours.
Paste the URL(s) you want scraped. We'll reply within 24 hours with a feasibility check and a ballpark quote.