Jump to section
- Table of Contents
- Why Market Trend Analysis Is a Pipeline Problem
- What Market Trend Analysis Actually Means
- Core Methods for Reading Trend Direction
- Time series methods
- Seasonality and cohort logic
- Regression, segmentation, and qualitative checks
- Signals and Metrics That Confirm a Real Trend
- Price structure comes first
- Confirmation matters more than prediction
- Validation should be part of the signal layer
- Sourcing the Data Behind the Trend
- The source mix usually matters more than the source label
- Operational checks decide whether a source is viable
- Governance belongs in sourcing decisions
- Building a Reliable Trend Data Pipeline
- Managed operations reduce hidden maintenance
- Review loops keep the pipeline honest
- Common Pitfalls That Distort Trend Signals
- Use Cases and How to Get Started
You’re looking at a dashboard that looks clean, the line is moving, and someone in the meeting wants a conclusion now. That’s the moment market trend analysis either becomes useful or turns into a confident mistake. The difference usually isn’t the chart, it’s whether the data behind it was sourced, refreshed, governed, and reviewed well enough to trust.
A good trend program starts before the visualization. Analysts have to decide where the data comes from, how often it updates, what gets normalized, who checks exceptions, and how they’ll tell a real shift from a temporary spike. That’s why trend work is closer to building a data product than writing a report.
Table of Contents
Open Table of Contents
- Why Market Trend Analysis Is a Pipeline Problem
- What Market Trend Analysis Actually Means
- Core Methods for Reading Trend Direction
- Signals and Metrics That Confirm a Real Trend
- Sourcing the Data Behind the Trend
- Building a Reliable Trend Data Pipeline
- Common Pitfalls That Distort Trend Signals
- Use Cases and How to Get Started
Why Market Trend Analysis Is a Pipeline Problem
Most bad trend calls don’t start with a bad chart, they start with a weak feed. If the source is incomplete, the refresh cadence is wrong, or the schema changes without anyone noticing, the analysis can look precise while drifting away from reality. That’s why a serious market trend analysis workflow needs the same discipline you’d apply to any production data system.
The analyst’s job is to separate signal, noise, and operational error. A dashboard can’t do that on its own, because the dashboard only reflects whatever has already been collected, transformed, and approved upstream. If the collection layer is brittle, the trend line inherits that brittleness.
Practical rule: trust the visualization only after you’ve checked the source, the timing, and the review layer.
A useful mental model is to treat trend work as four connected pillars. First, methodology, which decides how direction is measured. Second, signals, which tell you whether the move is durable. Third, data operations, which govern sourcing, validation, and refresh. Fourth, human review, which catches the cases automation misses.
That reframing matters because trend reliability is usually decided long before the chart is built. A team can have strong analysis skills and still produce weak outputs if the underlying data supply chain is inconsistent. For a practical contrast between collection approaches, see web scraping vs API tradeoffs, because source choice affects everything that follows.
When you think about trend analysis this way, the question changes. It’s no longer, “What does the chart say?” It becomes, “Can this trend be defended if someone challenges the source, the timing, or the definitions?”
What Market Trend Analysis Actually Means
Market trend analysis is the discipline of identifying persistent directional movement across multiple periods, then deciding whether that movement is structural, cyclical, or temporary. It’s not the same as forecasting, and it’s not the same as a one-time market snapshot. A forecast tries to predict what comes next, while trend analysis asks what direction the data has already been taking and whether that direction still holds.
The easiest way to think about it is coastline versus waves. The coastline is the underlying trend, the waves are short-term volatility. If you only look at one wave, you can misread the shape of the shore. That’s why analysts lean on rolling windows, year-over-year comparisons, and multi-period trajectories instead of one observation.
JPMorgan’s long-run market guide shows why that discipline matters. U.S. equities had an average intra-year drop of 14.2%, yet annual returns were still positive in 35 of 46 years. JPMorgan’s long-run market guide is a strong reminder that a market can fall sharply and still finish the year higher.
A second anchor for credible trend work is long historical series. The CFA Institute notes that monthly total stock market return data and the risk-free rate are available back to June 1926, while S&P index returns are available monthly back to January 1926. The CFA Institute’s historical market data guide shows why long comparisons matter more than isolated points.
If you want a broader framing that connects market analysis to business decisions, the overview from Alpha Scala on analysis is a useful companion. The main point is simple, trend analysis lives on time, not on snapshots.
A single observation can be interesting. A series is what makes it defensible.
Core Methods for Reading Trend Direction
Time series methods
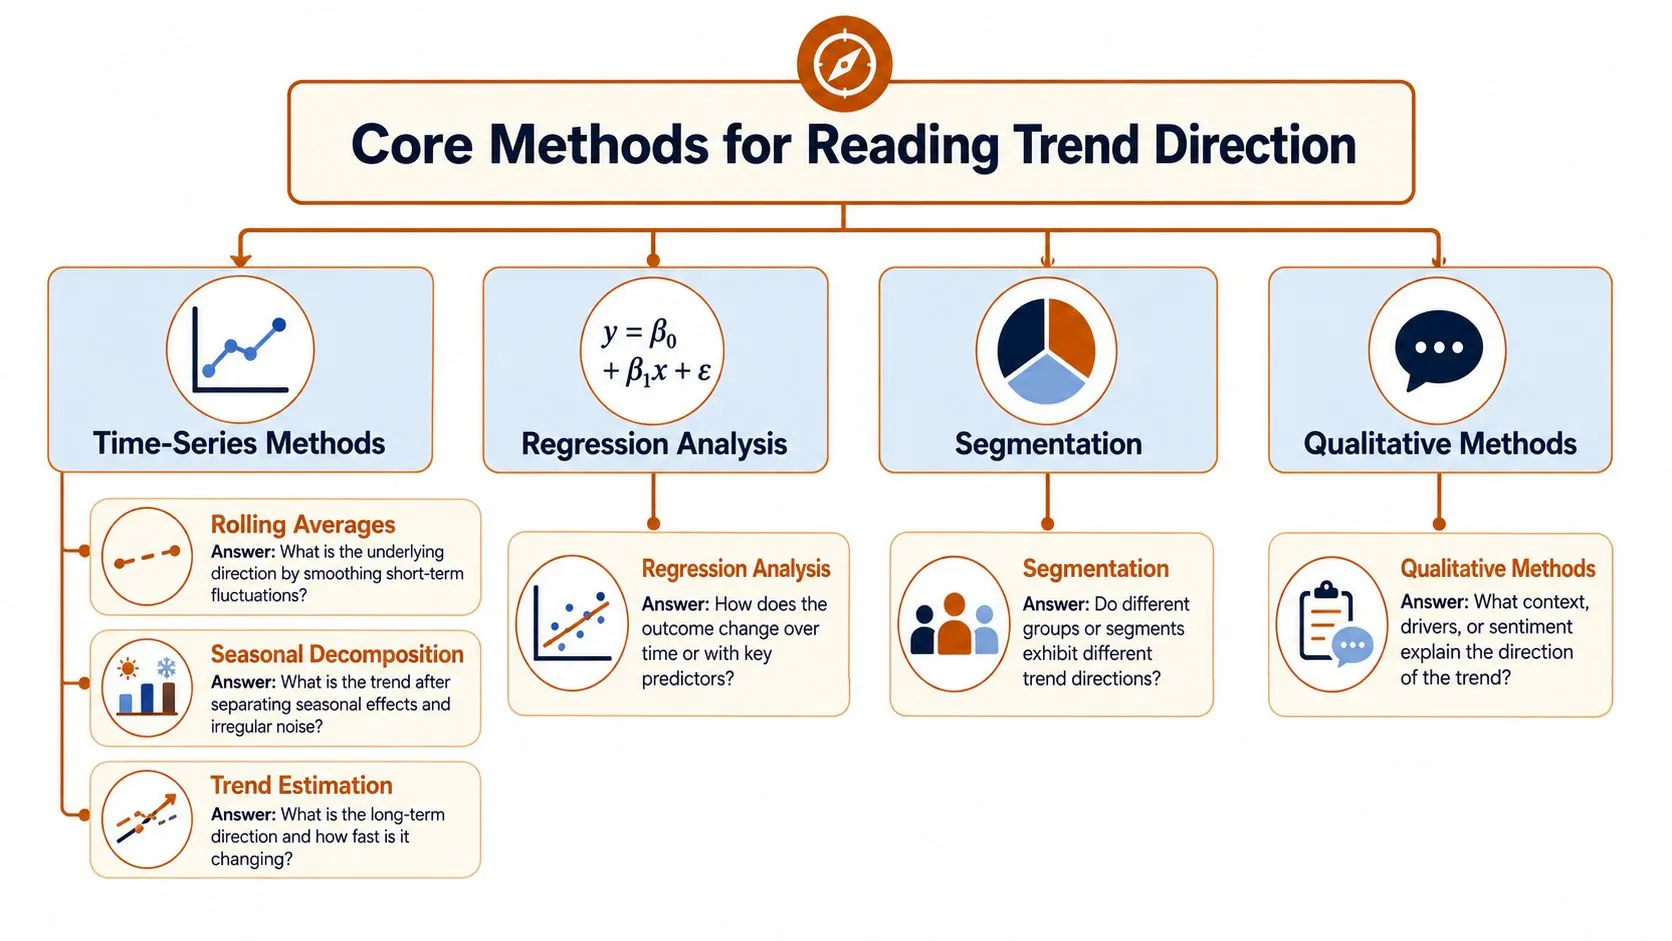
Time-series methods answer the most basic question, is the market moving up, down, or sideways over time? Rolling averages smooth erratic movement, year-over-year deltas show whether a period is beating its prior baseline, and regression slopes summarize direction across a window. These are usually the first tools analysts reach for because they’re readable and easy to explain to stakeholders.
They’re also easy to misuse. A short window can overreact to temporary shocks, while a long window can hide a turning point. That’s why the method has to match the cadence of the market, daily for price-sensitive categories, monthly or quarterly for slower-moving demand signals.
Seasonality and cohort logic
Seasonality decomposition separates recurring patterns from underlying movement, which is essential when the same month or quarter always behaves differently. Cohort analysis groups entities by a shared starting point, which is useful for retention, adoption, and lifecycle patterns. If you’re studying product uptake or customer behavior, cohort logic often tells you more than a broad market average.
The trap is treating a seasonal lift like a structural breakout. If winter demand rises every year, a January spike isn’t automatically proof of a new trend. It may just be calendar behavior doing what it always does.
Regression, segmentation, and qualitative checks
Regression helps quantify slope and compare variables, but it shouldn’t be the only lens. Segmentation shows whether a trend is concentrated in one geography, channel, or customer group, and that can reveal whether the move is broad or local. Qualitative methods, including interviews and behavioral review, help validate whether the numbers reflect genuine demand or just a surface-level signal.
For teams that monitor retail or category movement, ecommerce price monitoring workflows are a practical example of how method choice changes the result. The point is to choose the question first, then choose the method that can answer it cleanly.
Matching rule: use the simplest method that can survive a challenge from someone who disagrees with your conclusion.
Signals and Metrics That Confirm a Real Trend
Price structure comes first
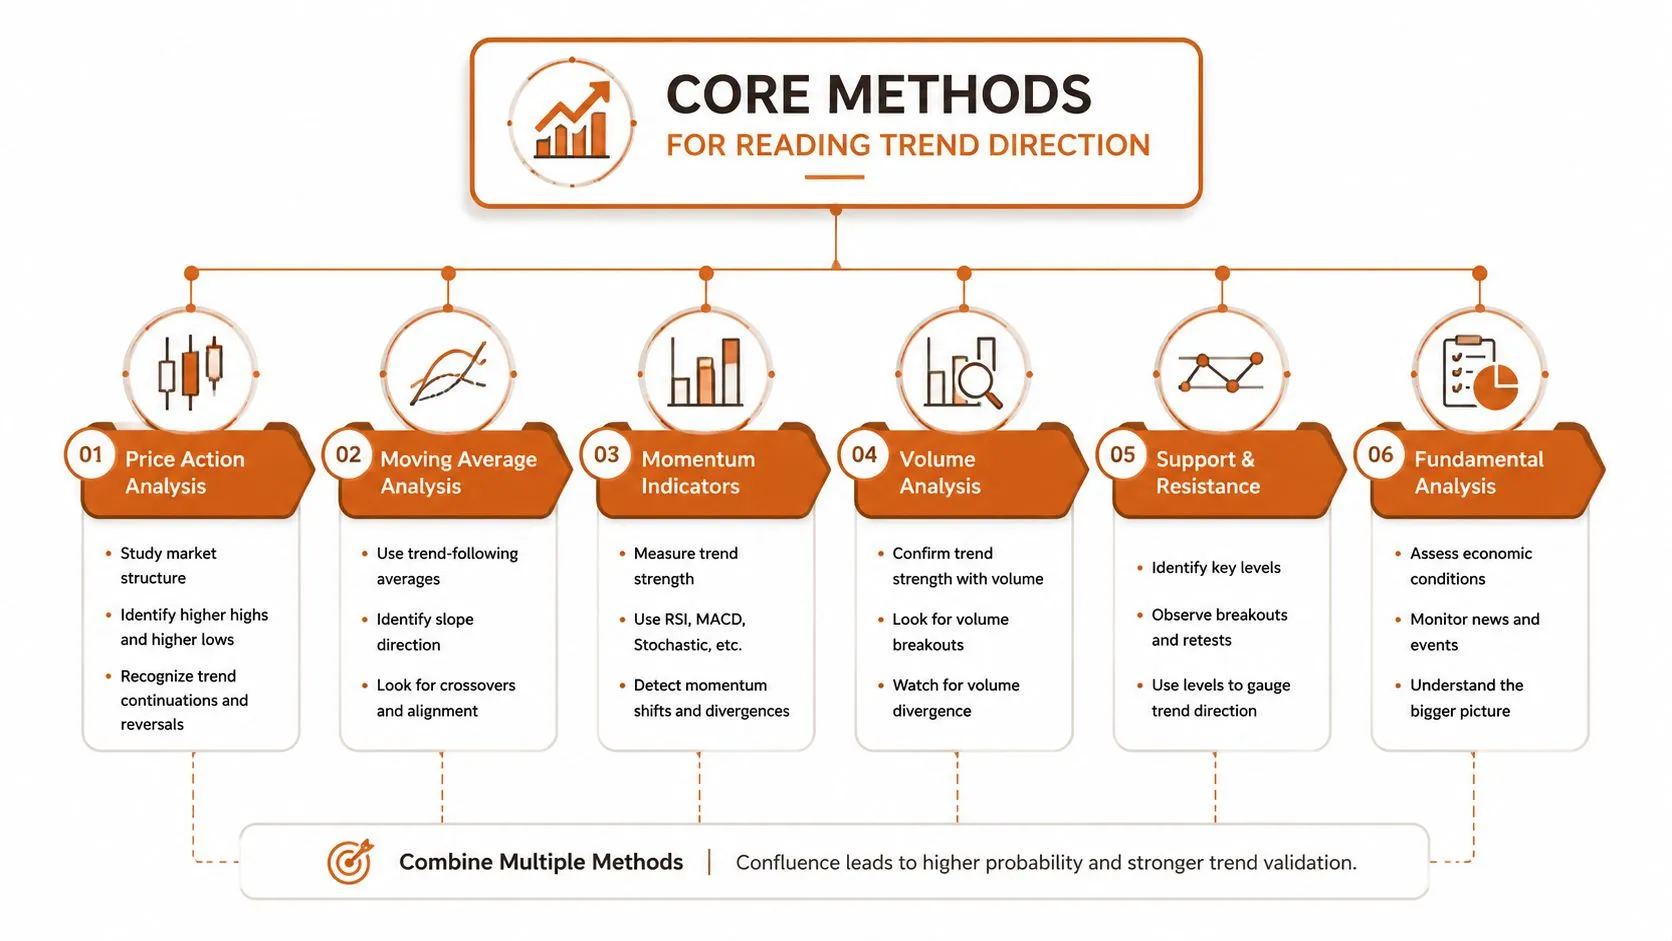
In technical analysis, the core signal is structure. An uptrend shows successive higher highs and higher lows, while a downtrend shows lower highs and lower lows. That peak-and-trough pattern is the basic test for trend continuation or reversal across liquid markets such as equities, indices, FX, and commodities. Fidelity’s trend basics guide gives the cleanest short definition of that framework.
The reason analysts start there is practical. Structure is visible, explainable, and stable enough to anchor the rest of the workflow. If the market isn’t making the expected sequence, the rest of the indicators may be arguing with the wrong premise.
Confirmation matters more than prediction
A trend signal becomes more believable when price moves are accompanied by rising volume. That doesn’t guarantee continuation, but it does suggest broader participation rather than a thin, isolated move. Moving averages and crossover patterns help compare current action to recent baseline behavior, while momentum tools such as RSI, MACD, and ADX help distinguish strength from churn. Fidelity’s indicator guide explains why these overlays are often paired with price structure.
That’s also where tool selection matters. If your team is choosing how to monitor these signals in production, pick the right market analysis tool by checking whether it supports the indicators you plan to review, not just the ones that look impressive in a demo.
Validation should be part of the signal layer
The last mistake is assuming indicator logic is enough by itself. Trend calls need data validation, because bad timestamps, missing rows, or duplicated records can make a stable market look unstable. A disciplined team runs its output through data validation checks before anyone treats the signal as a decision input.
Rising volume with structure is more persuasive than structure alone. Structure with broken data is not persuasive at all.
Sourcing the Data Behind the Trend
The source mix usually matters more than the source label
Trend work usually depends on a mix of web scraping, APIs, and commercial feeds. Each has tradeoffs, and the right answer depends on freshness, coverage, schema control, maintenance burden, and cost. A single source can work for a narrow use case, but production programs often need more than one input because no source is perfect across all five criteria.
Web scraping is strongest when you need unusual fields, custom layouts, or sites that don’t expose the exact data you need through an API. APIs are cleaner when the provider already offers the structure and refresh you want. Commercial feeds can reduce maintenance, but they can also constrain flexibility if the schema doesn’t fit your workflow.
| Source Type | Freshness | Coverage | Schema Control | Maintenance Burden |
|---|---|---|---|---|
| Web Scraping | High when scheduled well | Broad across public sites | High | Higher |
| API | Strong when the provider updates quickly | Limited to exposed endpoints | Medium | Lower |
| Commercial Feed | Depends on vendor refresh | Depends on vendor scope | Lower to medium | Lower |
Operational checks decide whether a source is viable
Freshness is only one part of the decision. You also need to check terms of use, rate limits, anti-bot defenses, language coverage, and geographic coverage. A source that looks attractive in a demo can become expensive or fragile once you try to run it every day, across multiple markets, with consistent field definitions.
That’s why how to use web scraping for market research is a better question than “Should we scrape or not?” The question is whether the source mix supports the cadence and level of precision your analysis needs.
Governance belongs in sourcing decisions
A good sourcing plan also anticipates downstream governance. If a vendor changes its schema without notice, or if a site starts serving different content by geo, the trend output can drift. The best teams choose sources not just for what they can collect today, but for how stable the collection will be next month and next quarter.
Building a Reliable Trend Data Pipeline
A market trend pipeline starts to break long before the chart does. The failure usually begins in scoping, then shows up in ingestion, extraction, schema validation, transformation, normalization, delivery, and monitoring. If any stage is undocumented, a site change, a field rename, or a partial outage can look like demand moved when the problem is really operational.
Governance belongs inside the analysis workflow, not beside it. Schema versioning, quality controls, exception handling, and audit trails let analysts explain where a figure came from and what changed along the way. If the record cannot be traced, the trend is only partly可信, even if the chart looks clean.
Managed operations reduce hidden maintenance
Proxy handling, CAPTCHA defenses, retries, and re-tuning consume more time than many teams expect. When those tasks sit on the analyst’s desk, they crowd out interpretation and comparison across sources. Managed services shift that operational work out of the review layer so analysts can focus on signal quality instead of site maintenance.
WebscrapingHQ is one option for that layer. It builds and runs extraction pipelines with monitoring, retries, and delivery on fixed schedules, which can fit recurring market intelligence workflows. For teams that want a clearer path from extraction to downstream systems, Donely’s platform integrations show how output can be connected to the rest of the stack. For a deeper look at building scalable pipelines, see our guide on building scalable data pipelines with Scrapy.
Review loops keep the pipeline honest
Human review is the layer that catches exceptions automation will miss. Analysts should inspect outliers, verify unusual shifts against source changes, and confirm that the same business definition is being used over time. A number can move for many reasons, but if the definition changed, the issue is documentation, not market movement.
A resilient pipeline makes review routine. It should flag when something changed, show which records need a second pass, and make the decision trail easy to inspect before anyone publishes the result.
Common Pitfalls That Distort Trend Signals
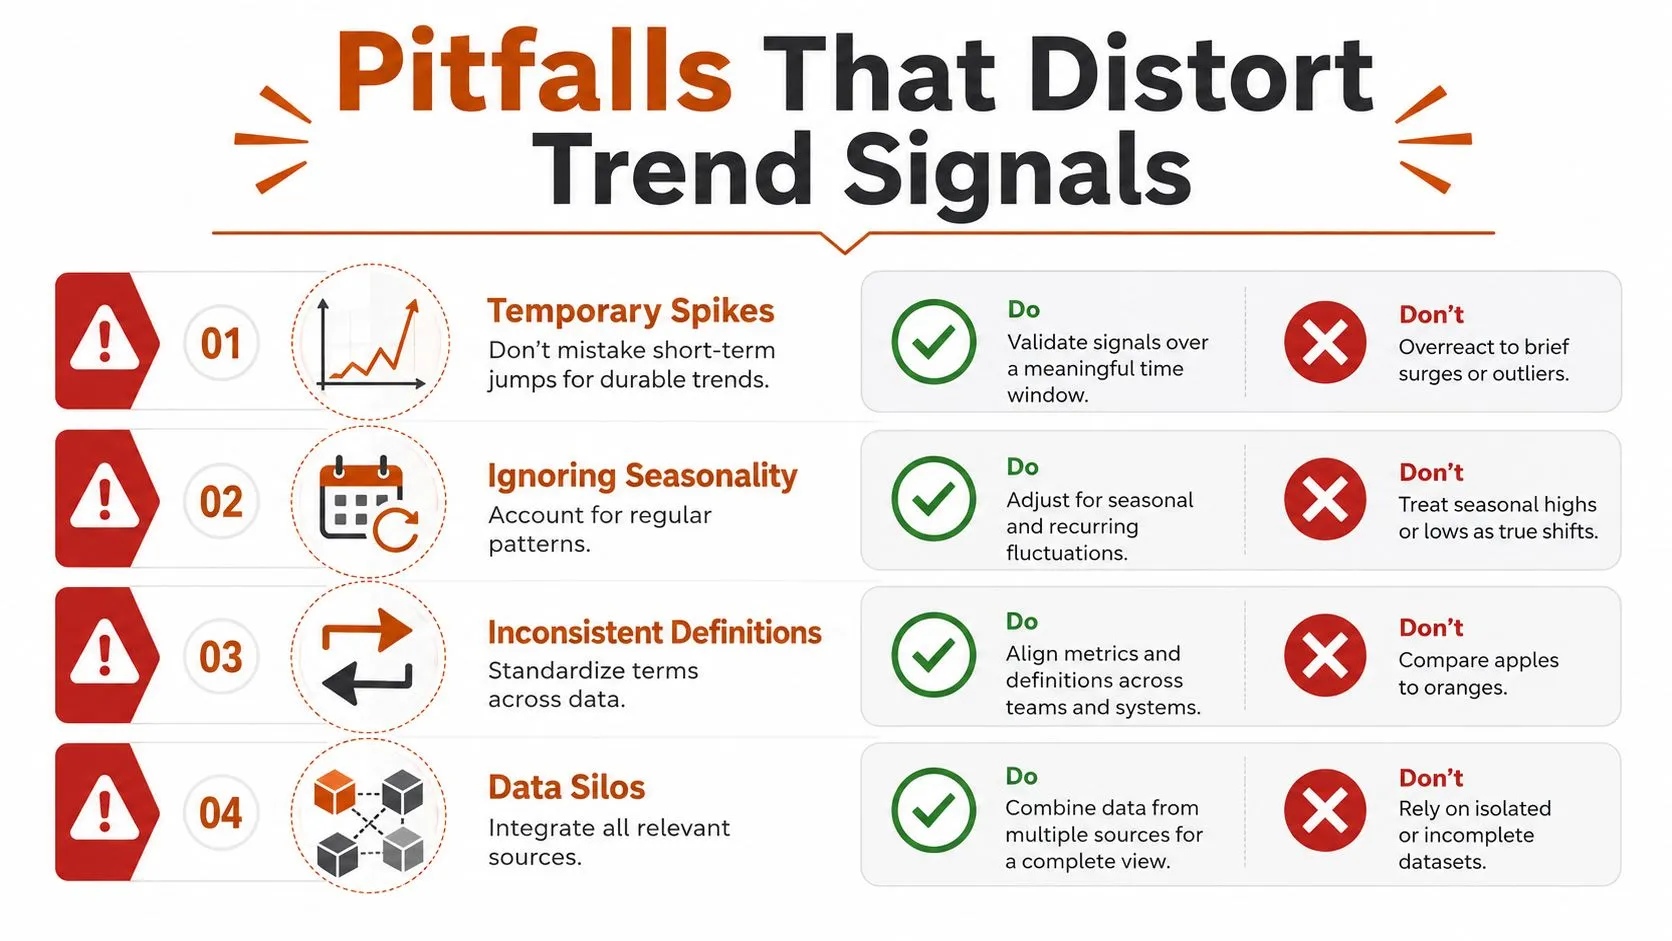
The most common mistake is treating a temporary spike as proof of durable demand. A one-off jump can come from promotion timing, scraping noise, a batch release, or a supply-side disruption that won’t repeat. If the team reports it too early, the narrative hardens before the evidence does.
Ignoring seasonality is the next classic error. A market that always lifts in one period can look like it’s breaking out when it’s only following its normal cycle. The fix is simple in concept, harder in practice, compare the new period against the right historical baseline before you call it movement.
Checklist habit: ask whether the same pattern appears in adjacent periods, nearby geographies, or related categories.
The underserved question is whether the signal reflects real demand or short-lived noise. One way to test that is to cross-check growth indicators against geography, seasonality, and supply-side evidence such as import or production shifts. When a change appears in one region but not another, or when the supply picture moves in the opposite direction, the trend deserves a second look.
Definitions cause their own damage. If the category logic changes across months, or if different teams label the same entity differently, the series stops being comparable. That’s why governance, review, and source documentation belong in the same checklist as the chart itself.
Use Cases and How to Get Started
Retail teams use daily price and assortment tracking to watch competitive moves, dealer compliance teams use monthly review cycles to flag exceptions, SEO and growth teams use scheduled SERP monitoring to spot ranking shifts, and AI teams collect multi-geo consumer signals for model training. The workflow changes, but the logic stays the same, define the question, choose the source mix, set the cadence, and design a review layer that can catch drift before it reaches leadership.
If you’re starting from scratch, begin with one market question and one repeatable source. Then add governance, validation, and a human review step before widening the scope. That’s how trend work stays useful after the first dashboard goes live.
If you need a team that can build and run the data collection layer behind market trend analysis, WebscrapingHQ handles recurring extraction, validation, and delivery for web sources that change over time. Visit WebscrapingHQ to discuss a pipeline for pricing, compliance, search, or market research data that needs to stay current and defensible.
Want this done for you?
Send us the URLs. We'll quote it in 24 hours.
Paste the URL(s) you want scraped. We'll reply within 24 hours with a feasibility check and a ballpark quote.