Jump to section
- What Retail Price Intelligence Actually Means
- The Four Drivers Behind Every Price
- People
- Product
- Period
- Place
- How the Market Has Scaled
- Inside the Price Intelligence Pipeline
- 1. Retailer discovery and URL seeding
- 2. Collection at a controlled cadence
- 3. HTML and JSON parsing, then normalization
- 4. Data matching and enrichment
- 5. Delivery to analytics and decision systems
- The Moderation Sweet Spot for Dynamic Pricing
- Turn moderation into alert design
- Data Quality, Governance, and Audit Readiness
- Data quality
- Governance
- Audit readiness
- Operationalizing Feeds for Analytics and Machine Learning
- 1. Define the data contract
- 2. Build the serving layer
- 3. Match the consumption pattern to the user
- 4. Monitor the feed like production software
- The Road Ahead for Price Intelligence Teams
Monday morning, a pricing analyst opens her dashboard and sees that a key competitor has cut the price of a flagship product by 12% overnight. Before changing anything, she checks several retailer sites, confirms that the listings describe the same item, separates a temporary promotion from the standard selling price, estimates the effect on margin, and submits a counter-action for review. The difficult part isn’t spotting the number. It’s deciding whether the number is comparable, current, commercially meaningful, and safe to act on.
That decision process is the practical purpose of retail price intelligence. It turns scattered observations from retailer websites, marketplaces, promotions, inventory signals, and internal systems into a reliable operating input for pricing, merchandising, and assortment decisions. The central challenge isn’t collecting more prices. It’s making sure each price can be trusted.
What Retail Price Intelligence Actually Means
The analyst in the opening example is doing more than checking a competitor’s website. She’s following a disciplined sequence:
- Collect the observation. The system records the competitor, product page, displayed price, currency, availability, promotion language, and collection time.
- Validate the comparison. It checks whether the competitor listing represents the same model, size, pack, condition, and seller type.
- Normalize the context. Taxes, shipping, loyalty discounts, coupons, regional availability, and promotional windows can change the effective price.
- Interpret the movement. A 12% reduction might indicate a planned campaign, a clearance event, an inventory problem, or a short-lived display error.
- Connect the signal to economics. The pricing team models volume, margin, inventory, and brand-position implications before deciding whether to respond.
- Route the decision. A recommendation moves into a dashboard, approval queue, pricing engine, or documented exception workflow.
That makes retail price intelligence the structured practice of collecting, matching, normalizing, and interpreting market pricing data. A one-off scrape can provide a value. An analyst’s manual competitor check can answer a narrow question. Neither creates a dependable system unless the organization preserves context, history, quality indicators, and decision lineage. The difference is similar to the difference between taking a photograph and operating a camera system that records a continuous, searchable archive.
Practical rule: A price observation isn’t intelligence until the business can explain what was observed, what it was matched to, how current it is, and what decision it supports.
The infrastructure can include retailer discovery, scheduled collection, product matching, historical storage, alerting, analytics, and downstream integrations. Teams evaluating external options may also compare Tagada’s pricing while assessing how different services handle collection scope and delivery requirements. For background on why automated collection matters, this overview of why scraping ecommerce websites is essential for price monitoring provides useful operational context.
The most valuable output isn’t a report that someone reads once a week. It’s a trustworthy signal that helps a category manager answer a specific question: Is this a real competitive change, and what should we do about it?
The Four Drivers Behind Every Price
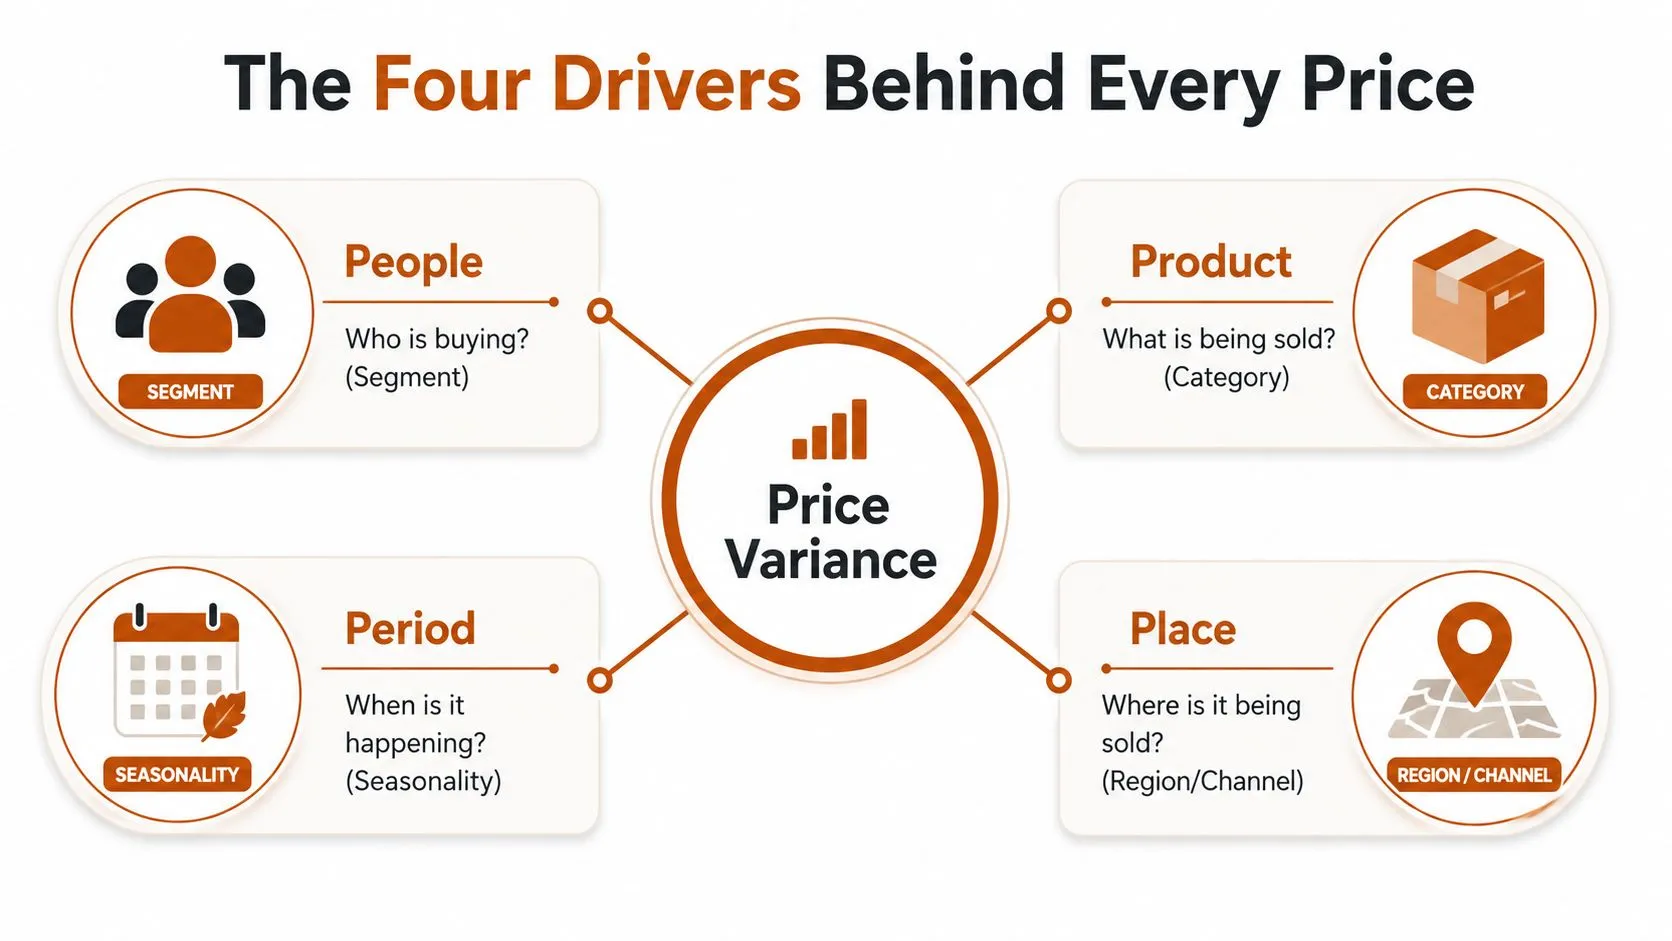
A price should never be interpreted as an isolated field. A useful diagnostic model asks four questions: who is buying, what is being sold, when is it happening, and where is it being sold. These four drivers explain why two retailers can show different prices for what appears to be the same product without either retailer being mistaken.
People
The buyer may belong to a different segment, use a different channel, or receive a different offer. A marketplace member might see a loyalty price that a guest shopper won’t see. A business buyer may purchase through a negotiated account while a consumer sees a public price. If a pipeline doesn’t preserve customer and channel context, the analyst may compare two valid prices as if they were identical offers.
Product
The visible product name often hides important differences. A television may share a model family with another listing but have a different screen size, regional configuration, included accessories, warranty, or bundle composition. A multipack and a single unit can look similar in search results, while a refurbished item can sit beside a new item under the same broad title.
Period
Timing changes meaning. A price captured during a weekend promotion shouldn’t automatically be treated as the retailer’s permanent position. Seasonality, launch timing, clearance activity, and a competitor event can all create temporary movement. Historical observations help distinguish a durable shift from a brief interruption.
Place
Geography, store format, marketplace, and fulfillment method also matter. A Walmart online listing and a Target online listing for a comparable television might show different prices because of regional availability, shipping economics, seller arrangements, or promotional calendars. The comparison becomes useful only after the system records where each offer was available and under what fulfillment conditions.
The technical basis for this approach is the idea that dynamic pricing responds to people, product configurations, periods, and places, rather than treating price as static. The Journal of Retailing review on dynamic pricing frames pricing as algorithmic adaptation to market conditions. That same lens helps a category manager investigate a price gap instead of reacting to it blindly.
Teams also need to choose monitoring capacity with care. When comparing vendors or service plans, you can compare subscription tiers against the number of sources, refresh requirements, and data-quality controls your workflow needs. A market trend analysis process can then place individual price changes inside broader category movement rather than treating every observation as an emergency.
How the Market Has Scaled
Retail price intelligence has moved from a specialist analyst activity into a substantial software and analytics category. One market analysis estimates the global pricing intelligence AI market at $6.2 billion in 2025, with a projection of $29.8 billion by 2034, implying a 19.4% CAGR. The same analysis identifies retail as the largest application vertical, with $1.86 billion in 2025 revenue, representing 30.0% of the market. These figures are projections and estimates from Marketintelo’s pricing intelligence AI market analysis.
Retail attracts this investment for practical reasons. Assortments contain many products, sellers operate across direct sites and marketplaces, promotions alter effective prices, and pricing decisions connect directly to revenue and margin. Travel also changes prices frequently, but retail teams must reconcile product identity, pack size, condition, availability, seller type, and fulfillment context at the same time. Finance often has more centralized instruments and feeds. Retail has a fragmented digital shelf.
Three pressures have accelerated adoption:
- Marketplace proliferation: More channels create more competitive observations and more opportunities for inconsistent positioning.
- Faster repricing expectations: Retail teams increasingly need current signals, especially in categories where competitors adjust prices frequently.
- Accessible data infrastructure: Cloud warehouses, managed collection services, event queues, and modern analytics tools make recurring pipelines more practical than isolated spreadsheets.
The historical direction is visible in the UK’s institutional price tracking. The British Retail Consortium says its Shop Price Monitor has monthly data from 2005 to the present, compiled by NIQ on behalf of the BRC. That long-running series shows how retail price observation can become a durable measurement system rather than a temporary project. The same broader market context reports that about 45% of pricing decisions are now automated, up from 18% five years earlier, a 27-point shift toward algorithmic pricing governance. Those figures appear in the market analysis cited above.
| Vertical | Share of CI Spend | Adoption Intensity | Typical Use Case |
|---|---|---|---|
| Retail | Largest application vertical in the cited market analysis | High | Competitor prices, promotions, assortment, and margin decisions |
| Travel | Not specified in the verified data | Qualitatively high price sensitivity | Fare and availability comparison |
| Finance | Not specified in the verified data | Context-dependent | Market and instrument monitoring |
| Other sectors | Not specified in the verified data | Varied | Category-specific competitive research |
Retail’s scale doesn’t make every implementation mature. It makes weak matching, stale feeds, and undocumented transformations more expensive. Teams exploring regional data operations can also review web scraping services in the UAE when their coverage requires localized collection and delivery.
Inside the Price Intelligence Pipeline
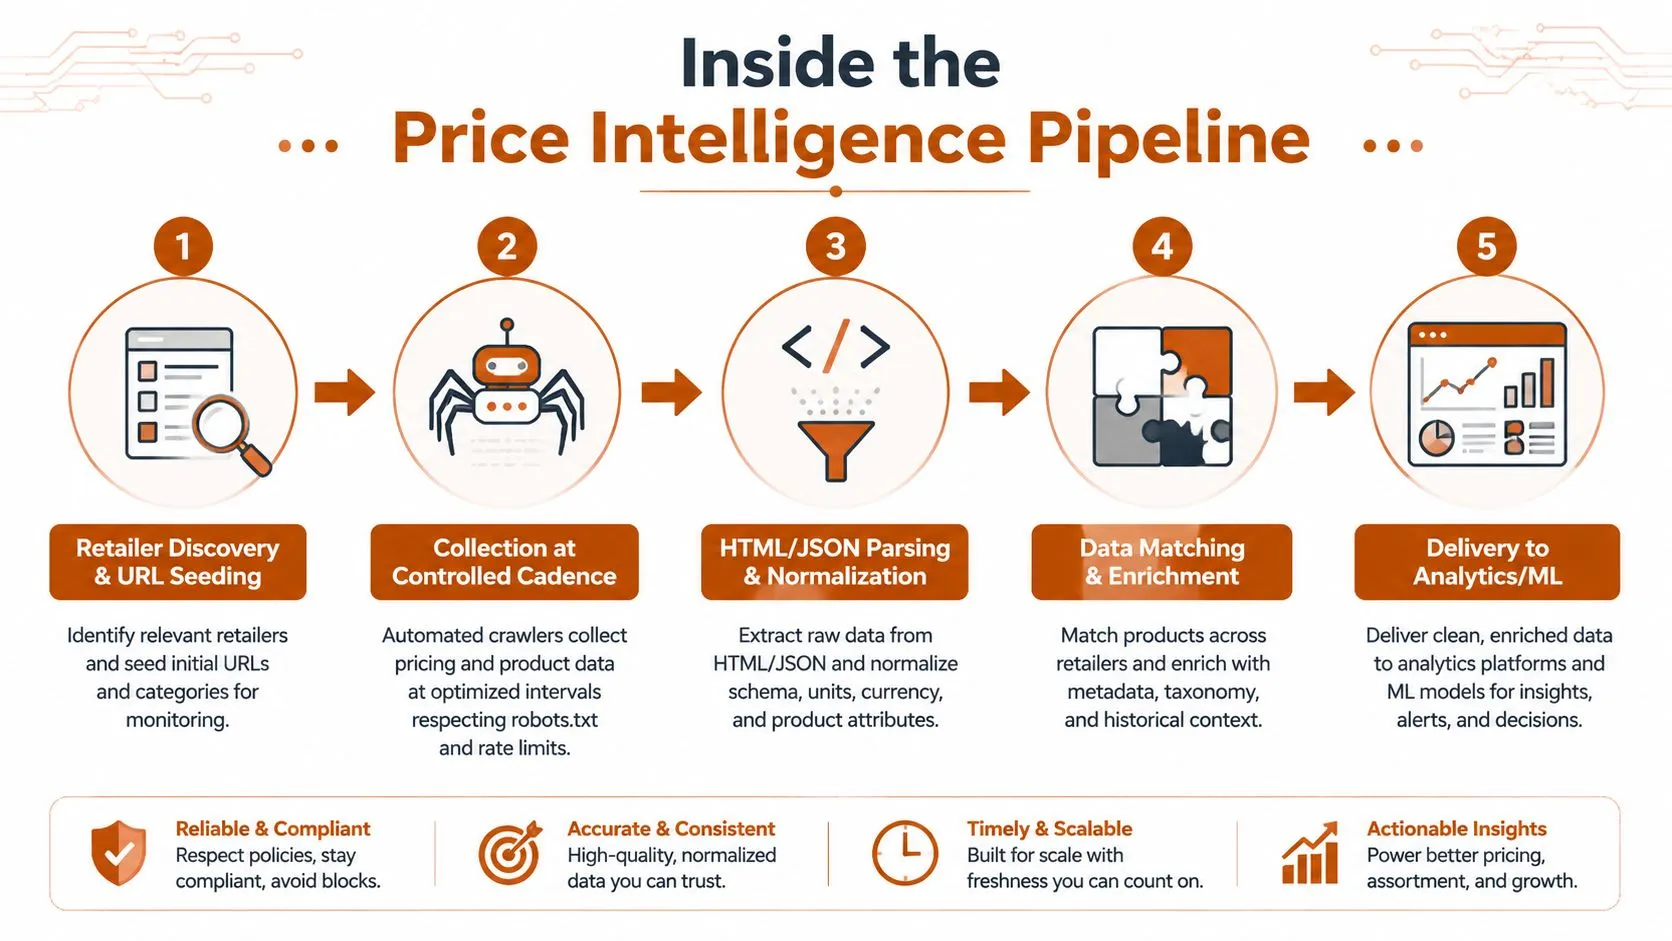
A reliable pipeline separates collection from interpretation. The system should be able to show where an observation came from, how it was transformed, what product it represents, and when it became available to downstream users.
1. Retailer discovery and URL seeding
Start with a controlled source registry. For each retailer or marketplace, record the domain, product-search method, category scope, geography, expected page structure, and collection permissions. Seed URLs can come from known product pages, retailer search results, sitemaps, feeds, or an internal catalog.
Suppose an appliance brand tracks four SKUs across 30 retailers daily. The seed layer should identify the relevant product page for each retailer and preserve the relationship between the brand SKU and the external URL. A URL isn’t a permanent identity. Retailers redirect pages, change slugs, retire listings, and create seller-specific offers.
2. Collection at a controlled cadence
The collection layer retrieves pages or structured responses according to category volatility and business importance. It may use browser automation, APIs, or a managed extraction service. Rate limiting, proxy rotation, retries, response validation, and anti-bot handling affect whether the resulting feed is complete and consistent.
A scraper that retrieves a page successfully isn’t necessarily reliable. It might receive a challenge page, a regional variant, a logged-out price, or an incomplete response. Store the raw response or an appropriate evidence artifact alongside parsed fields so operators can investigate anomalies.
3. HTML and JSON parsing, then normalization
Retail pages expose prices in different locations and formats. A parser may read structured JSON, embedded metadata, visible HTML, or rendered content. Normalization then converts currencies, tax treatments, units, promotion labels, availability states, and seller details into a consistent schema.
Freshness needs an explicit definition. A feed can be technically recent but operationally late if the source changed before collection, parsing failed, or the warehouse load stalled. Teams that need a clearer framework can understand data freshness with digna before setting service expectations.
4. Data matching and enrichment
Matching is where many systems fail. Collection can return a plausible price, yet the comparison becomes harmful if the listing represents a different variant, bundle, condition, or seller. Match logic may combine model numbers, brand, title attributes, images, specifications, pack size, and category rules. Each match should carry a confidence value and an explanation that a reviewer can inspect.
5. Delivery to analytics and decision systems
The final layer publishes normalized observations to a warehouse, dashboard, alert service, feature store, webhook, or pricing engine. Batch ETL is usually easier to control and audit. Streaming APIs can reduce decision latency but add complexity around ordering, retries, cost, and consumer compatibility.
A practical ecommerce price monitoring workflow treats delivery as part of the product, not as an afterthought. Category managers need usable alerts, analysts need historical tables, and machine learning systems need point-in-time data. One raw feed rarely satisfies all three without carefully designed serving layers.
The Moderation Sweet Spot for Dynamic Pricing
Dynamic pricing works best when the organization treats movement as a controlled experiment, not a race to match every competitor change. A multi-retailer U.S. panel study reported that dynamic pricing increased revenue by 12.3% on average, while cart abandonment also rose by 8.7%. The study found the strongest net outcome at moderate price variation, with an apparent coefficient-of-variation sweet spot between 0.04 and 0.06. These figures come from the Journal of Retailing panel study.
The lesson isn’t that every retailer should copy a particular volatility range. The lesson is that more movement can create competing effects. A repricer may capture additional revenue in one situation while making shoppers hesitate, encouraging competitors to respond, or weakening the credibility of a stable value position.
| Strategy | Avg. Price Change per Cycle | Margin Impact | Conversion Stability | Customer Trust Signals |
|---|---|---|---|---|
| Fixed pricing | No automated movement | Protects consistency, but can miss market changes | Stable until the market shifts | Predictable |
| Moderate dynamic pricing | Controlled variation informed by context | Balances response with margin protection | More stable than aggressive repricing in the cited panel evidence | Easier to explain and monitor |
| Aggressive repricing | Frequent reaction to small competitor moves | Greater risk of margin erosion and price wars | More vulnerable to abandonment and volatility | Can appear inconsistent |
Turn moderation into alert design
A good alerting system doesn’t notify a category manager about every change. It evaluates at least four signals:
- Magnitude: Is the movement commercially meaningful after normalization?
- Persistence: Has the price remained changed across multiple observations?
- Confidence: Does the product match have strong evidence?
- Exposure: Does the item matter for revenue, inventory, or strategic positioning?
A small observed change may deserve no alert if it falls inside routine noise. A smaller change may deserve escalation if the product is a high-visibility item with weak margin protection. Thresholds should vary by category, product role, and channel rather than using one universal rule.
An alert should answer “why act now?” rather than merely report “something changed.”
Use cooldown windows to prevent repeated notifications for the same event. Route high-confidence, low-risk changes to a dashboard, while sending uncertain matches or changes with material margin consequences to human review. Teams should also document the action taken, not just the alert generated. That history helps analysts assess whether the system identifies genuine threats or amplifies temporary market noise.
Ethical collection matters in this operating model because a useful alert depends on lawful, respectful, and technically controlled data acquisition. Guidance on ethical data collection can help teams define source boundaries and reduce the risk that operational shortcuts undermine the intelligence program.
Data Quality, Governance, and Audit Readiness
The strongest pricing model can’t rescue an unreliable input. If a competitor bundle is matched to a single item, a delayed update is treated as current, or a marketplace seller is confused with the platform itself, the algorithm can make a mathematically consistent but commercially wrong recommendation.
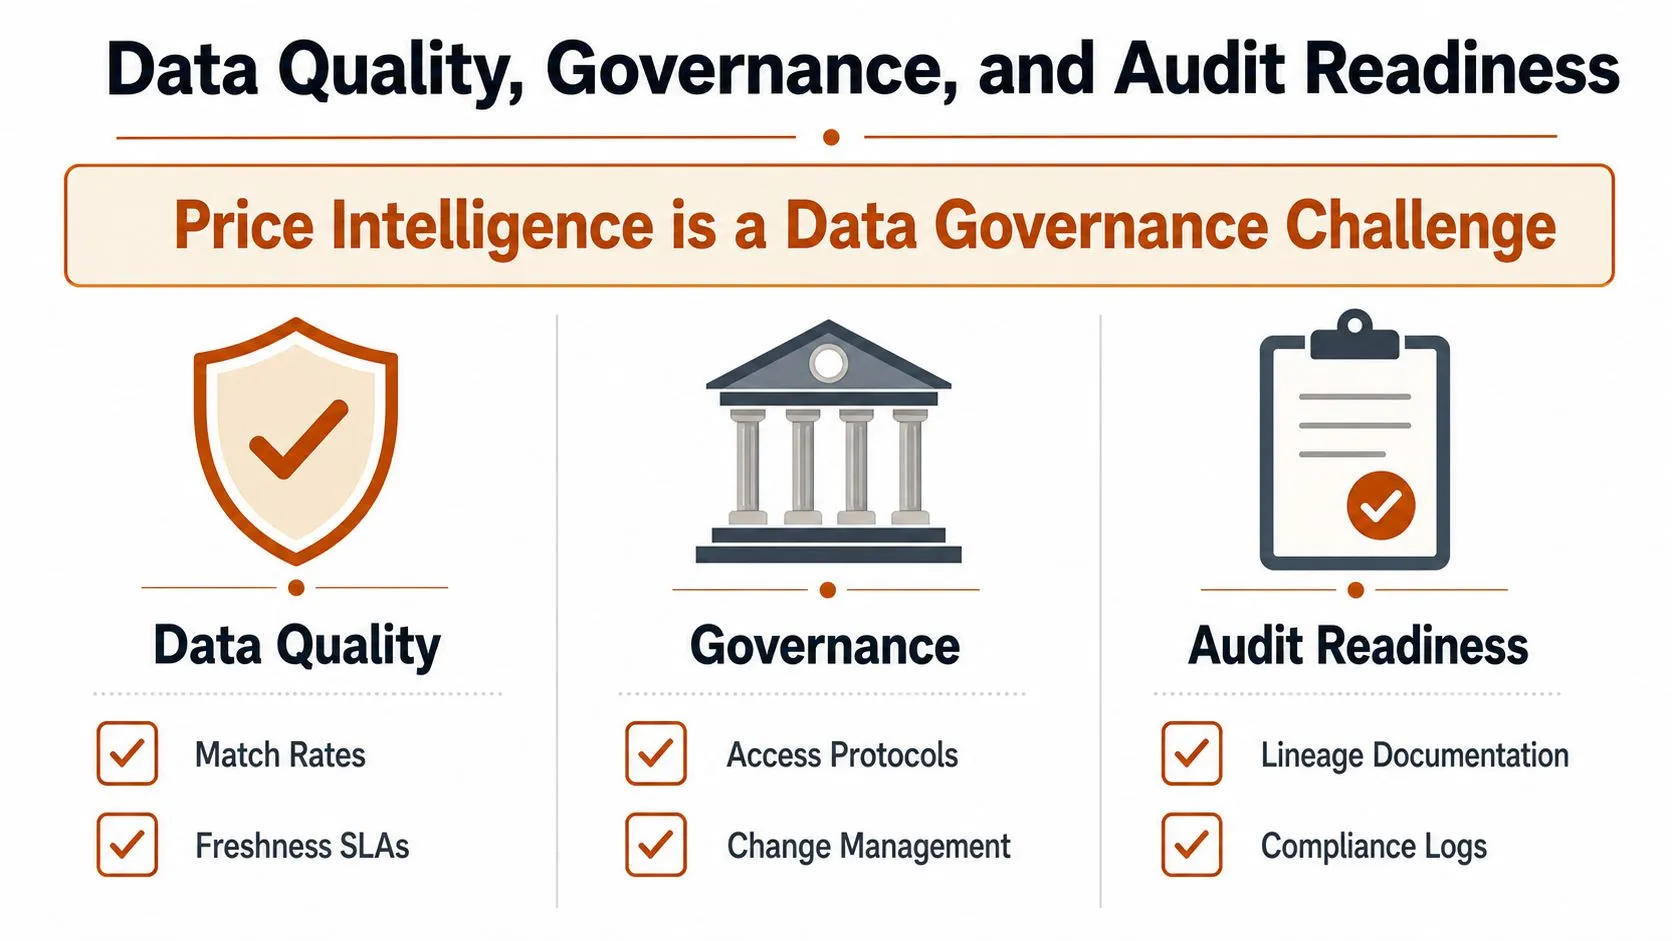
That makes retail price intelligence a data-governance problem before it becomes an optimization problem. Governance determines whether the organization can trust the signal, control its use, explain its transformations, and defend its decisions when a stakeholder, regulator, or customer asks for evidence.
Data quality
Start with measurable service expectations rather than a vague promise of “fresh data.”
- Match quality: Record whether the external listing is an exact item, an approved equivalent, or an unresolved candidate.
- Freshness: Define how quickly observations should arrive for each category and what happens when the service level is missed.
- Source coverage: Track which retailers, sellers, regions, and product families are represented.
- Schema consistency: Version field definitions so a change in a retailer’s page doesn’t alter downstream meaning.
A quality dashboard should show missing observations, abnormal price jumps, stale records, parsing failures, and confidence drift. Match rate alone isn’t enough. A system can report a high match rate by accepting weak matches, which creates a more dangerous form of false confidence.
Governance
Governance assigns responsibility. A data steward should own definitions for effective price, availability, promotion status, seller identity, and product equivalence. Access controls should distinguish people who can view raw observations from those who can approve pricing actions. Marketplace data may also contain seller information, so teams need clear rules for collection, retention, and use.
Lineage is the connecting thread. Each published price should be traceable to a source observation, collection event, parser version, normalization rule, match decision, and downstream recommendation.
Audit readiness
An audit-ready system keeps immutable records of price observations, transformations, overrides, approvals, and decisions. The record should make it possible to reconstruct what the business knew at the time, not merely show the latest corrected value.
This matters as public-sector and consumer expectations converge around pricing transparency. The UK’s statistics authority announced a shift from collecting about 25,000 store prices a month to analyzing roughly 300 million pricing points from more than 1 billion grocery sales per month, covering around half the grocery market, according to the report on the UK’s grocery pricing data initiative. The same source reports that 82% of Americans view clear pricing and no hidden fees as essential to a better shopping experience.
If the system can’t defend its output, predictive accuracy won’t protect it from operational or regulatory failure.
Retention policies, documentation standards, review queues, and change-management records aren’t administrative extras. They’re how pricing teams show that an automated recommendation came from an identifiable observation and an approved rule.
Operationalizing Feeds for Analytics and Machine Learning
A raw pricing feed becomes useful only after downstream consumers can rely on its meaning. Four operating decisions make that transition practical.
1. Define the data contract
Write down the fields and their semantics before building dashboards or models. The contract should specify retailer identifiers, currency, tax treatment, promotion representation, seller type, availability, collection timestamp, ingestion timestamp, and schema version.
This prevents each consumer from making a private assumption. One analyst might treat a displayed price as tax-inclusive while another adjusts it independently. A versioned contract makes the difference visible and gives engineering a controlled way to introduce changes.
2. Build the serving layer
Normalized observations should land in a warehouse table, lakehouse, or feature store with stable keys and historical validity. Machine learning pipelines need point-in-time correctness. A training record must contain only the competitor information available at the decision moment, or the model will learn from future data and produce misleading evaluation results.
Keep raw evidence separate from curated tables. The raw layer supports investigation, while curated layers support analysis and controlled consumption.
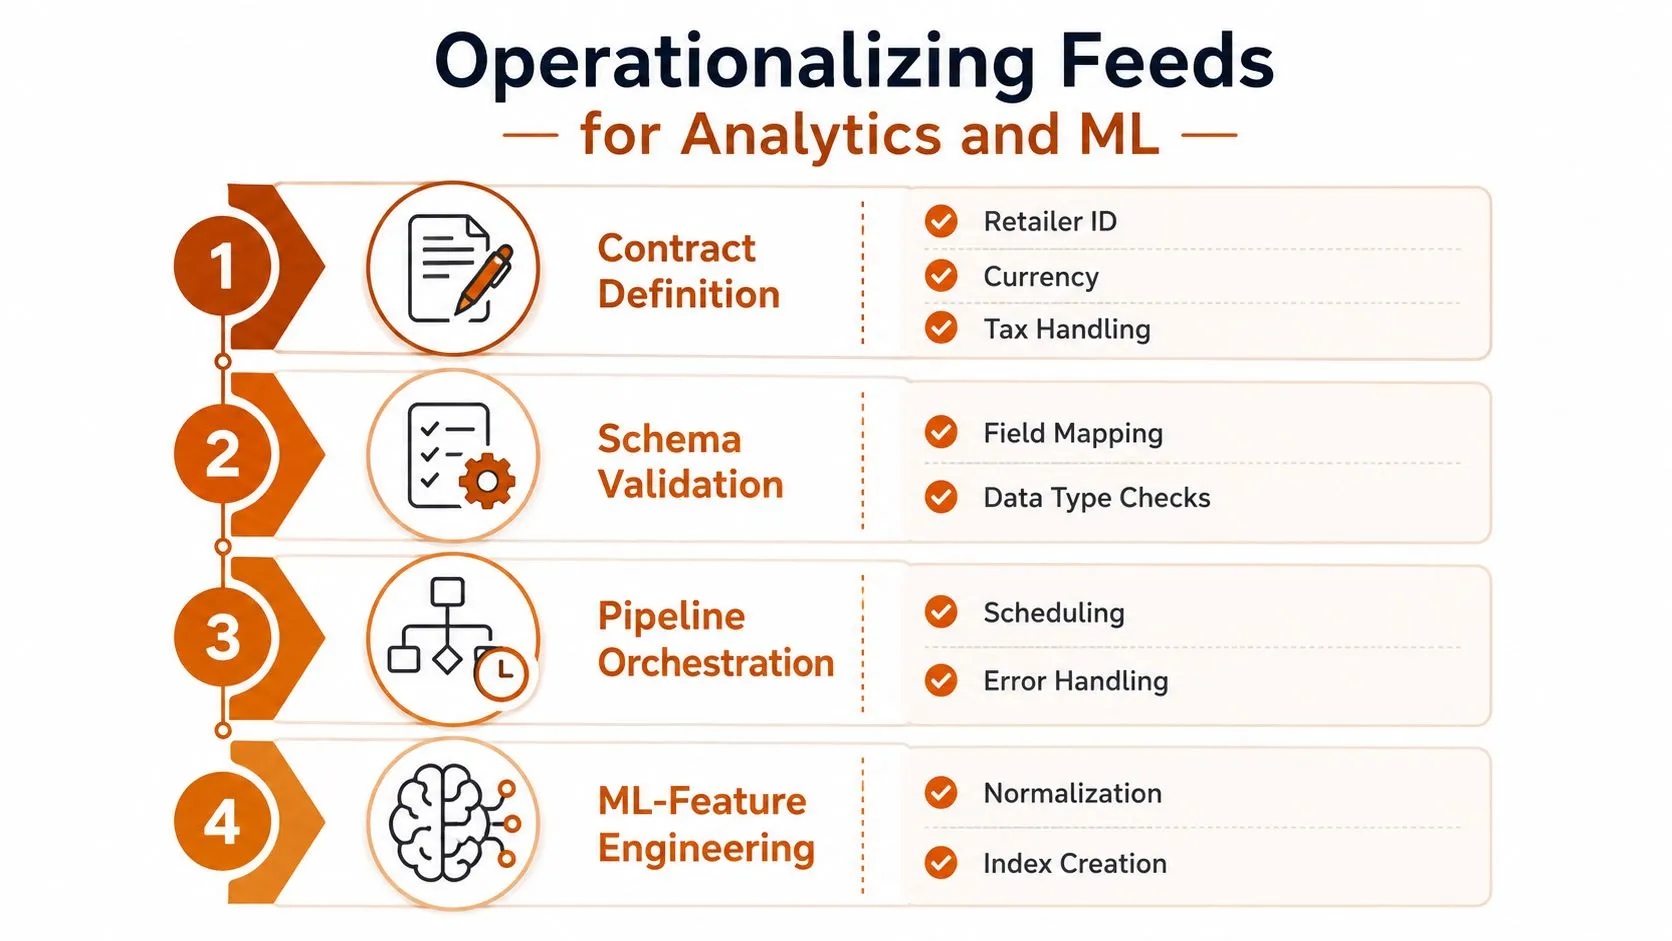
3. Match the consumption pattern to the user
A category manager needs a dashboard showing current position, exceptions, product context, and recommended action. An analyst may need historical price trajectories and promotion comparisons. A model may consume normalized competitor indices, elasticity features, or event flags through a batch feature pipeline.
Don’t force every consumer onto a streaming architecture. Batch delivery can be appropriate for slower categories and easier to reconcile. Faster feeds make sense when the business decision loses value quickly, but they require stronger controls around ordering, duplicates, retries, and cost.
4. Monitor the feed like production software
Track parser errors, missing retailers, freshness, match confidence, schema changes, and unusual distributions. Monitor model performance separately, including recommendation accuracy and drift in the underlying match population.
Treat scraped prices as evidence, not ground truth. A human-in-the-loop review layer should inspect uncertain matches, unexpected changes, and decisions that cross approved risk boundaries. Every model output inherits upstream errors unless the workflow gives people a way to challenge them.
The Road Ahead for Price Intelligence Teams
Retailers now sit across a maturity gap. One team may review competitor prices in a weekly spreadsheet, manually investigate exceptions, and update a planning file. Another may operate a near-real-time pipeline that feeds elasticity models and responds to competitor movement within the hour. The difference isn’t only automation. It’s the quality of the identifiers, timestamps, matching rules, controls, and feedback loops underneath the workflow.
The next advantage won’t come from collecting every available price. It will come from better-governed data. Teams need trustworthy product identity, clear effective-price definitions, source coverage they can explain, and machine-readable records that preserve the context behind each observation. Stricter transparency expectations in major markets and the growth of automated shopping experiences make those requirements operational rather than theoretical.
A practical starting plan is straightforward:
- Audit one existing feed: Trace several observations from source capture to dashboard or pricing recommendation, checking lineage, freshness, and transformation rules.
- Pilot matching in one category: Choose a category with meaningful commercial value, review ambiguous variants and bundles manually, and measure confidence before expanding.
- Assign governance ownership: Give a named data steward responsibility for definitions, access, quality thresholds, retention, and change management.
Teams that follow these steps can improve decision quality without rushing into full automation. The objective is controlled responsiveness, where pricing systems move quickly because their inputs and rules are dependable.
WebscrapingHQ provides managed web data operations and custom extraction pipelines that can collect structured competitor pricing, maintain scheduled monitoring, and deliver feeds or reports for analytics workflows. Visit WebscrapingHQ to discuss a price intelligence pipeline with source coverage, freshness, matching, and governance requirements defined up front.
Want this done for you?
Send us the URLs. We'll quote it in 24 hours.
Paste the URL(s) you want scraped. We'll reply within 24 hours with a feasibility check and a ballpark quote.