
Jump to section
- What a Monitoring Pipeline Looks Like Before the Scraper
- Defining the InfluxDB Scraper in Plain Language
- Two Ways to Scrape Into InfluxDB
- How Prometheus Metrics Become InfluxDB Points
- The Freshness Gap Between Nominal and Observed Data
- Measure Each Handoff
- Controlling Label Cardinality Before It Controls You
- Use a Defensive Onboarding Workflow
- Governing Scraped Data Across Sources
- Production Checklist and Common Questions
A service team has added a /metrics endpoint, and a dashboard somewhere shows familiar counters and gauges. But when a graph goes stale, nobody’s sure whether the exporter stopped responding, the scraper fell behind, or InfluxDB failed to store the latest points. Understanding an InfluxDB scraper means following the data through each of those steps, not just entering a target URL.
The practical questions are straightforward: what does the scraper collect, how does it turn Prometheus metrics into InfluxDB points, and how can you tell whether those points are fresh and safe to store? The answers matter because two quiet production problems can hide behind a healthy-looking configuration: labels can multiply time-series identities, and slow collection or writes can make stored data older than the configured interval suggests.
What a Monitoring Pipeline Looks Like Before the Scraper
A metrics pipeline starts with a service or exporter that exposes measurements over HTTP. A scraper requests that endpoint on a schedule, parses the response, and sends the resulting points to an InfluxDB bucket. A dashboard or alert then queries the bucket. If you don’t know which part owns each step, a blank graph can send you chasing the wrong failure.
A useful way to think about the pipeline is as a chain of handoffs:
- The target exposes metrics. An application, node exporter, or infrastructure service makes machine-readable measurements available.
- The collector retrieves them. An InfluxDB scraper or Telegraf asks the target for its metrics at configured intervals.
- The collector maps the data. Metric names, labels, and sample values become InfluxDB measurements, tags, and fields according to the chosen mapping.
- The destination stores points. InfluxDB writes them to a bucket, where queries and dashboards can use them.
Each handoff can fail independently. The endpoint can be unreachable; a response can take too long or contain data the parser can’t handle; or the collector can retrieve metrics successfully but fail to write them. A dashboard showing old values doesn’t tell you which of these happened.
That distinction separates this use case from generic web extraction. An InfluxDB scraper is a scheduled metrics collector, not a crawler that browses pages or interprets arbitrary HTML. Teams designing broader data pipelines can compare approaches in this pipeline guide for banking leaders or explore a different collection pattern in this guide to scalable Scrapy pipelines.
By the end, you should be able to choose a collection path, reason about the resulting data model, and monitor the gap between a scheduled scrape and the freshness users receive.
Defining the InfluxDB Scraper in Plain Language
An InfluxDB scraper has four basic parts: an HTTP or HTTPS endpoint, a Prometheus-formatted response, a collection interval, and a bucket destination. The scraper requests the endpoint on its schedule, reads the exposition-format metrics, and writes the parsed data into the selected bucket.
Think of a postal worker following a regular route. The worker visits each address on schedule, collects what’s ready, and delivers it to a labeled mailbox. The route is the collection schedule, each endpoint is an address, and the bucket is the destination. This differs from an on-demand pull, where a user requests a measurement only when they need it. In scheduled scraping, collection continues whether or not a dashboard is open.
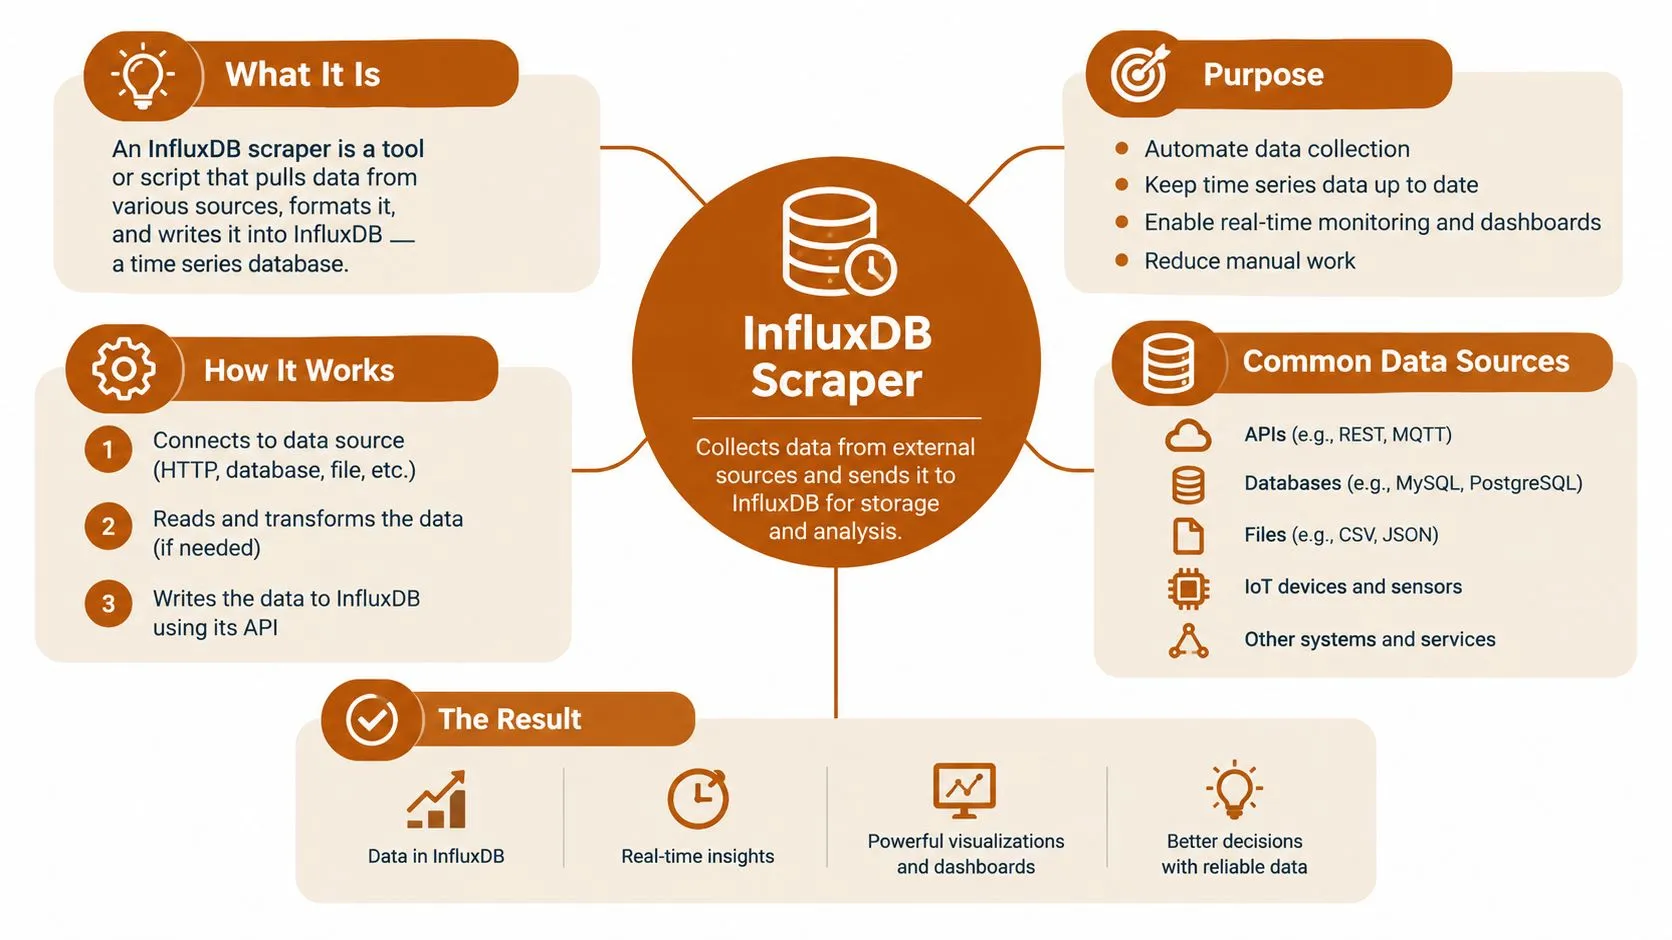
The response format is essential. InfluxDB’s native scraper is built to collect metrics from HTTP or HTTPS endpoints that expose Prometheus’s text-based metric format. That makes it suitable for applications, exporters, and infrastructure services that provide compatible metrics, including an endpoint commonly named /metrics. It doesn’t turn an HTML page into measurements or infer useful fields from arbitrary website content.
Practical rule: Confirm that the endpoint returns Prometheus exposition data before configuring collection. A reachable URL isn’t enough if the response isn’t in the expected format.
Once the endpoint speaks the right format, the scraper’s job is deliberately narrow: request, parse, and store. Telegraf can extend that path with additional processing, but the collection still begins with machine-readable metrics. That narrow contract is useful in production. It makes the boundary clear: the exporter owns what it exposes, the collector owns retrieval and mapping, and InfluxDB owns storage and querying.
The short definition is this: an InfluxDB scraper periodically fetches Prometheus-formatted metrics from a reachable endpoint and writes the parsed observations to a bucket. It isn’t a general-purpose web scraper, and its targets must speak the expected metrics format.
Two Ways to Scrape Into InfluxDB
Teams typically choose between InfluxDB’s native scraper and Telegraf’s Prometheus input plugin. Both collect Prometheus-formatted metrics and can ultimately deliver points to an InfluxDB bucket. The difference is where configuration and processing live: the native option is managed in InfluxDB, while Telegraf gives teams an agent-based pipeline with more room to transform and route data.
The native scraper is a direct fit when you want to configure a target and bucket within InfluxDB. It begins scraping roughly 10 seconds after creation and then uses a 10-second default interval, as described in the scraper management documentation. Don’t mistake that cadence for a promise that every point will be available exactly on schedule; the endpoint and write path still affect delivery.
Telegraf’s inputs.prometheus plugin accepts an array of target URLs and requests each one on the agent’s collection interval. It translates Prometheus responses into Telegraf metrics, which can then go to InfluxDB through an output plugin. The plugin’s metric version controls how the response maps into measurements, tags, and fields. See the Telegraf input plugin documentation for its collection and configuration model.
| Dimension | Native scraper | Telegraf prometheus_input |
|---|---|---|
| Control plane | Configure the scraper in InfluxDB. | Configure and run the Telegraf agent. |
| Collection cadence | Uses a 10-second default after creation. | Uses the agent’s configured collection interval. |
| Target definition | Set a metrics endpoint and bucket. | Provide target URLs in the urls array. |
| Processing options | Direct collection into InfluxDB. | Agent pipeline can include input, processor, aggregator, and output plugins. |
| Best fit | A direct, InfluxDB-managed collection path. | A self-managed pipeline needing agent-side configuration or processing. |
Choose the native scraper when the direct control plane fits your environment. Choose Telegraf when you need its broader pipeline capabilities or want collection configured and operated alongside other agent inputs. Neither option is universally better. The right choice depends on who should own the collector, where transformations belong, and how much control the team needs before data reaches the bucket.
How Prometheus Metrics Become InfluxDB Points
A Prometheus sample doesn’t arrive in InfluxDB as an unchanged row. The collector maps the metric name, labels, and value into InfluxDB’s data model. With Telegraf, the selected metric_version determines the shape of that mapping, so a change in version can change how queries address the stored data.
Under metric version 1, the Prometheus metric name becomes the Telegraf measurement name, labels become tags, and sample values become fields. Under metric version 2, samples share a prometheus measurement, labels still become tags, and the Prometheus metric name becomes the field key. Telegraf describes version 2 as a sparse layout suited to column-oriented destinations. These are different layouts for the same general observation, not different kinds of measurements.
The distinction between a tag and a field is easier to see with a library-card analogy. Tags are the labeled drawers in the card catalog: they help you filter observations by stable dimensions such as service, region, cluster, or status class. Fields are the contents recorded on a card: they hold the measured value or other observation.
A tag choice is therefore more than a naming preference. Prometheus labels become InfluxDB tags in the documented mapping, and every unique combination of measurement, tag keys, and tag values identifies a distinct series. A label that can take on many unique values, such as a request ID or a full URL with changing query parameters, can create a new identity repeatedly even if the scrape interval stays fixed.
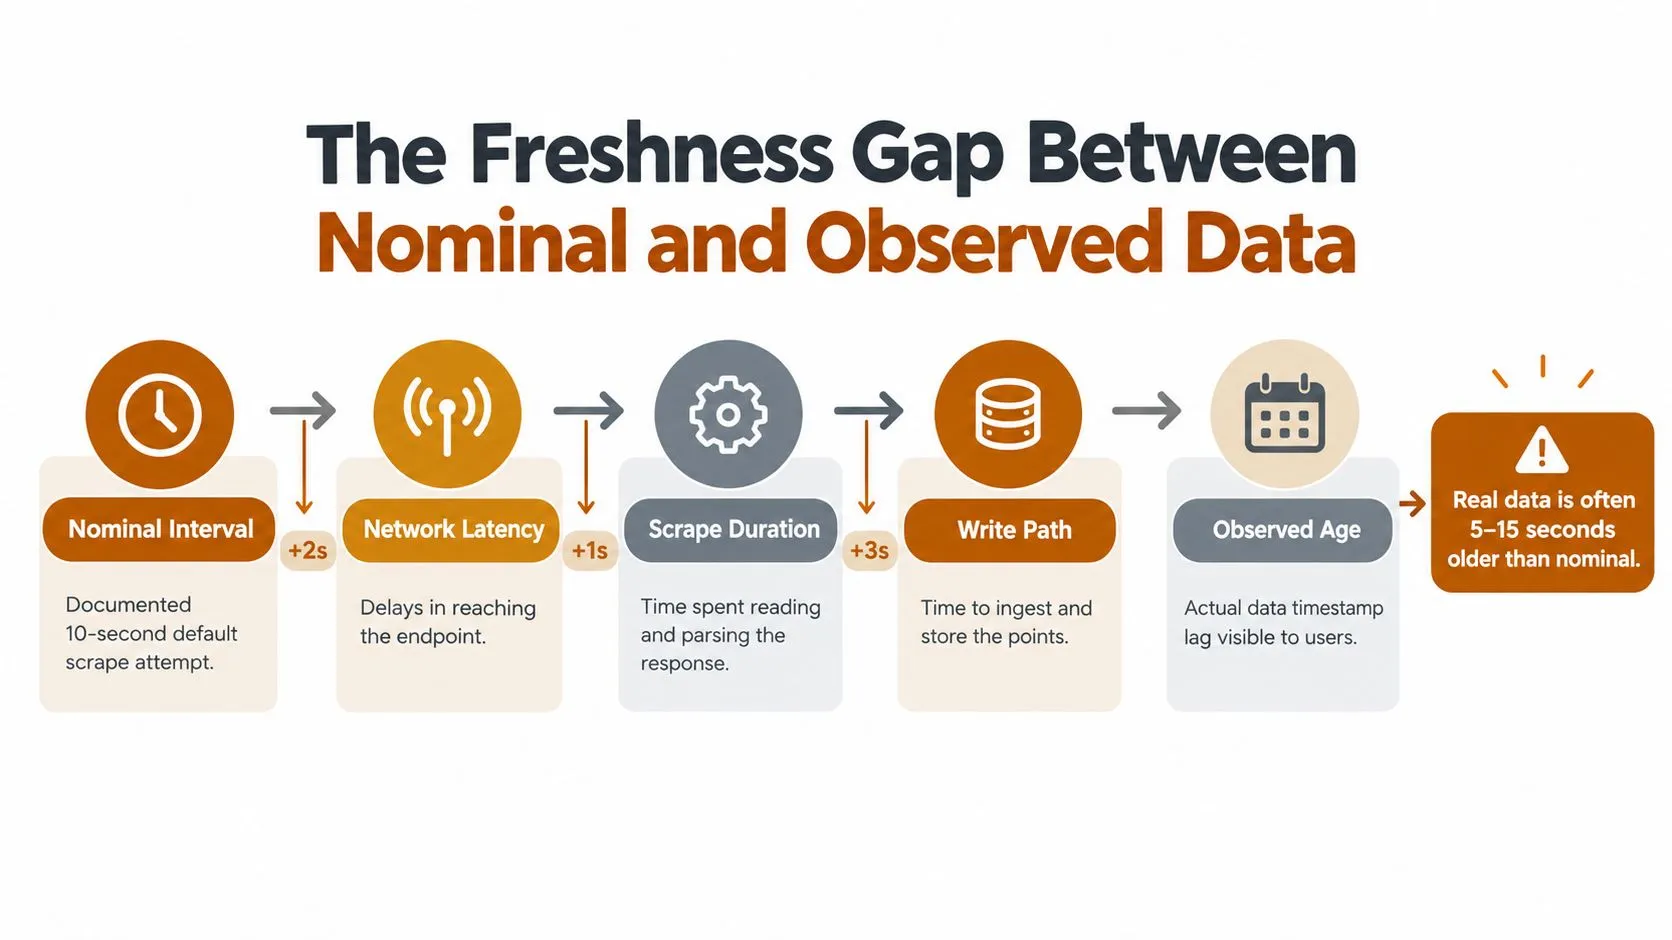
The diagram below shows why the collection interval alone can’t tell you how recent stored data is.
If the model still feels unfamiliar, this plain-language guide to data parsing provides useful context for the step between retrieving a response and turning it into structured records. The operational takeaway is simple: pick a metric version based on the query shape your team wants, then examine the labels that become tags before sending the data into production.
The Freshness Gap Between Nominal and Observed Data
A configured interval describes when a scraper attempts to collect data. It doesn’t tell you when the new points will be visible to a dashboard. The native scraper begins roughly 10 seconds after creation and continues at 10-second intervals by default, but endpoint response time, network delays, parsing, and writing can all affect when observations arrive.
Suppose a scrape is due, but the target responds slowly. The collector may spend time resolving the endpoint, establishing a secure connection, waiting for authentication, retrieving the response, and parsing it. A temporary outage or failed request can prevent collection altogether. Even a successful scrape can be followed by a delay if InfluxDB’s write path is contending with other work.
Measure Each Handoff
Don’t rely on one success signal. Instrument the stages separately so an operator can tell whether a target failed to respond, the collector couldn’t parse the response, or the write did not complete:
- Target response: Record whether the endpoint responded and how long it took.
- Scrape completion: Track when collection finished, not only when it was scheduled.
- Parser health: Count parse errors or other response-processing failures.
- Write outcome: Monitor whether the collected points reached InfluxDB.
- Timestamp age: Compare the time attached to stored observations with the current time to identify stale data.
These signals help separate a target outage from a delivery delay. For example, a healthy target response paired with failed writes points to a different part of the pipeline than repeated connection or authentication failures. Teams building broader data-quality checks can adapt ideas from these data quality monitoring tools.
A useful freshness measure follows a point from the target response through scrape completion and successful storage, then checks how old the latest stored timestamp is. This makes the gap visible instead of assuming the configured cadence equals observed freshness. Where several targets share a schedule, consider whether simultaneous requests could create bursts or stress endpoint rate limits.
Alert on freshness and collection success, not on whether a scraper configuration object exists. A saved configuration proves intent, not delivery.
Controlling Label Cardinality Before It Controls You
The main schema risk is uncontrolled label cardinality. Every distinct combination of measurement, tag keys, and tag values creates a separate time-series identity. A label with an unbounded or highly variable value can therefore multiply series even when the number of targets and the collection cadence remain unchanged.
Request IDs, user IDs, full URLs with query strings, timestamps, and free-form exception text are common warning signs. If an exporter emits these as labels, each unique value can create another series. The resulting burden isn’t limited to storage. More series can increase index and metadata size, memory use, compaction work, and write load.
Use a Defensive Onboarding Workflow
Start by inspecting the endpoint’s actual label set, not just the exporter’s configuration or a sample dashboard. For each label, ask whether its possible values are bounded and useful for filtering. A service name or region may be a stable dimension; a request ID or raw exception string usually isn’t.
Next, estimate the potential series count by multiplying the bounded combinations of label values that can coexist. This estimate is a planning tool, not a guarantee: verify it against real endpoint output, especially where labels can change over time. Then remove or normalize unbounded dimensions at the exporter or in Telegraf before they become tags in InfluxDB.
The metric-version choice affects the resulting point layout, but it doesn’t make unbounded tags safe. Version 1 uses metric names as measurements; version 2 uses a shared measurement and metric names as field keys. Both mappings still make label discipline important because labels become tags. Teams evaluating the operational implications can also review this discussion of cardinality’s impact on monitoring budgets.

Before approving a new target, document which labels are allowed, test the response for unexpected values, and decide which dimensions to drop or relabel. That gives the team a chance to catch a risky schema at the exporter boundary, before it becomes a capacity and query problem downstream.
Governing Scraped Data Across Sources
Metrics aren’t user-submitted records, but they still need ownership and governance. A team may change an exporter, add a label, rename a metric, or alter what a field means. Without a record of those changes, dashboards can break or compare incompatible data.
Start with a clear owner for each target. That team should know what the endpoint exposes, how the metrics are used, and who responds when collection or data quality fails. For each source, document the expected measurement and field shape, its metric-version choice, and the allowed tag dimensions. Treat changes to that contract as schema changes, not incidental edits.
A practical governance checklist looks like this:
- Assign ownership. Name the team responsible for the exporter, target availability, and schema changes.
- Record the schema. Document expected measurements, fields, tags, and permitted label values for each source.
- Set bucket policies. Choose retention and downsampling expectations based on how the data will be used.
- Check quality. Watch for missing expected metrics, sudden label changes, parse failures, and stale timestamps.
- Keep lineage. Record where a metric originates and which downstream dashboards or alerts depend on it.
These habits make it easier to tell a genuine application change from a collection or schema problem. They also help teams discuss scraped data as a managed asset, with versioning and quality controls, rather than an incidental output. The same approach appears in broader data governance by design practices.
A team can apply this before adding a target: name an owner, capture a representative response, define the schema contract, and agree on retention and quality checks. The result is a pipeline another operator can understand and maintain, even after the person who first configured the scraper moves on.
Production Checklist and Common Questions
Before calling a scraper production-ready, check the whole delivery path rather than stopping at configuration:
- Target: Confirm it returns Prometheus-formatted metrics and is reachable from the collector.
- Schema: Choose a metric version and review the resulting measurement, tag, and field layout.
- Cardinality: Reject or normalize unbounded labels before they become tags.
- Freshness: Track response time, scrape completion, write success, and timestamp age.
- Ownership: Record who maintains the target and who responds to collection or data-quality failures.
- Bucket: Set retention and data-quality expectations that match how the metrics will be used.
Should I choose metric version 1 or 2? Choose based on the query shape your team expects. Version 1 uses metric names as measurements; version 2 puts samples under a common prometheus measurement and uses metric names as field keys.
When should I prefer Telegraf? Use it when you need an agent-managed pipeline, a list of target URLs, or room for input, processing, and output configuration. The native scraper is a direct option when managing collection within InfluxDB suits the environment.
How can I detect a silent target change? Compare the observed measurements and labels with the documented schema. Alert on missing expected metrics, new or unexpected labels, parse failures, and stale timestamps.
How should I size a bucket for a target? Estimate the series created by the target’s bounded label combinations, inspect its real output, and account for the chosen retention policy. If your broader collection needs involve changing websites or external sources, this overview of online web scraping services describes a different operational problem from Prometheus metrics collection.
WebscrapingHQ provides managed web data operations and custom scraping pipelines, including schema-focused extraction and ongoing monitoring for changing sources. If your team also collects external web data and wants help managing its reliability and structure, visit WebscrapingHQ to discuss your requirements.
Want this done for you?
Send us the URLs. We'll quote it in 24 hours.
Paste the URL(s) you want scraped. We'll reply within 24 hours with a feasibility check and a ballpark quote.