Jump to section
- 1. Datadog Data Observability
- 2. Monte Carlo
- 3. Sifflet
- Where Sifflet fits ingestion work
- 4. Soda
- 5. Bigeye
- 6. Anomalo
- 7. Acceldata Data Observability Cloud
- 8. Elementary
- The ingestion gap
- 9. Astronomer Astro Observe
- 10. IBM watsonx.data integration Data Observability
- Data Pipeline Monitoring Tools at a Glance
- Choosing a Monitor or Handing the Pipeline to Someone Else
Most buyers are told to start with a warehouse dashboard and a freshness alert. That advice fails scraping and ingestion pipelines because the damaging failure isn’t a late table. It’s a successful run that returns half the records, the wrong price field, or duplicates after a site changed its template overnight. By the time a downstream check fires, you’ve already delivered bad data.
Good data pipeline monitoring tools for this workload must do four things well. They must flag job failures and long-running tasks, detect freshness, volume, and schema anomalies close to the source, route alerts to a named owner, and show enough lineage and run history to find the root cause without guessing. The scale of the problem is not theoretical. A 2019 DataKitchen and Eckerson survey reported that 79% of companies experienced more than three data-related errors in their pipelines every month.
This guide reviews ten platforms against alerting quality, SLO support, integrations, and cost transparency, with a specific test in mind. Can the tool catch site-triggered schema drift and a drop in per-source extraction success before a client does? Some fit that job. Several are excellent warehouse monitors and overkill, or blind, for ingestion. That distinction matters more than feature count.
1. Datadog Data Observability
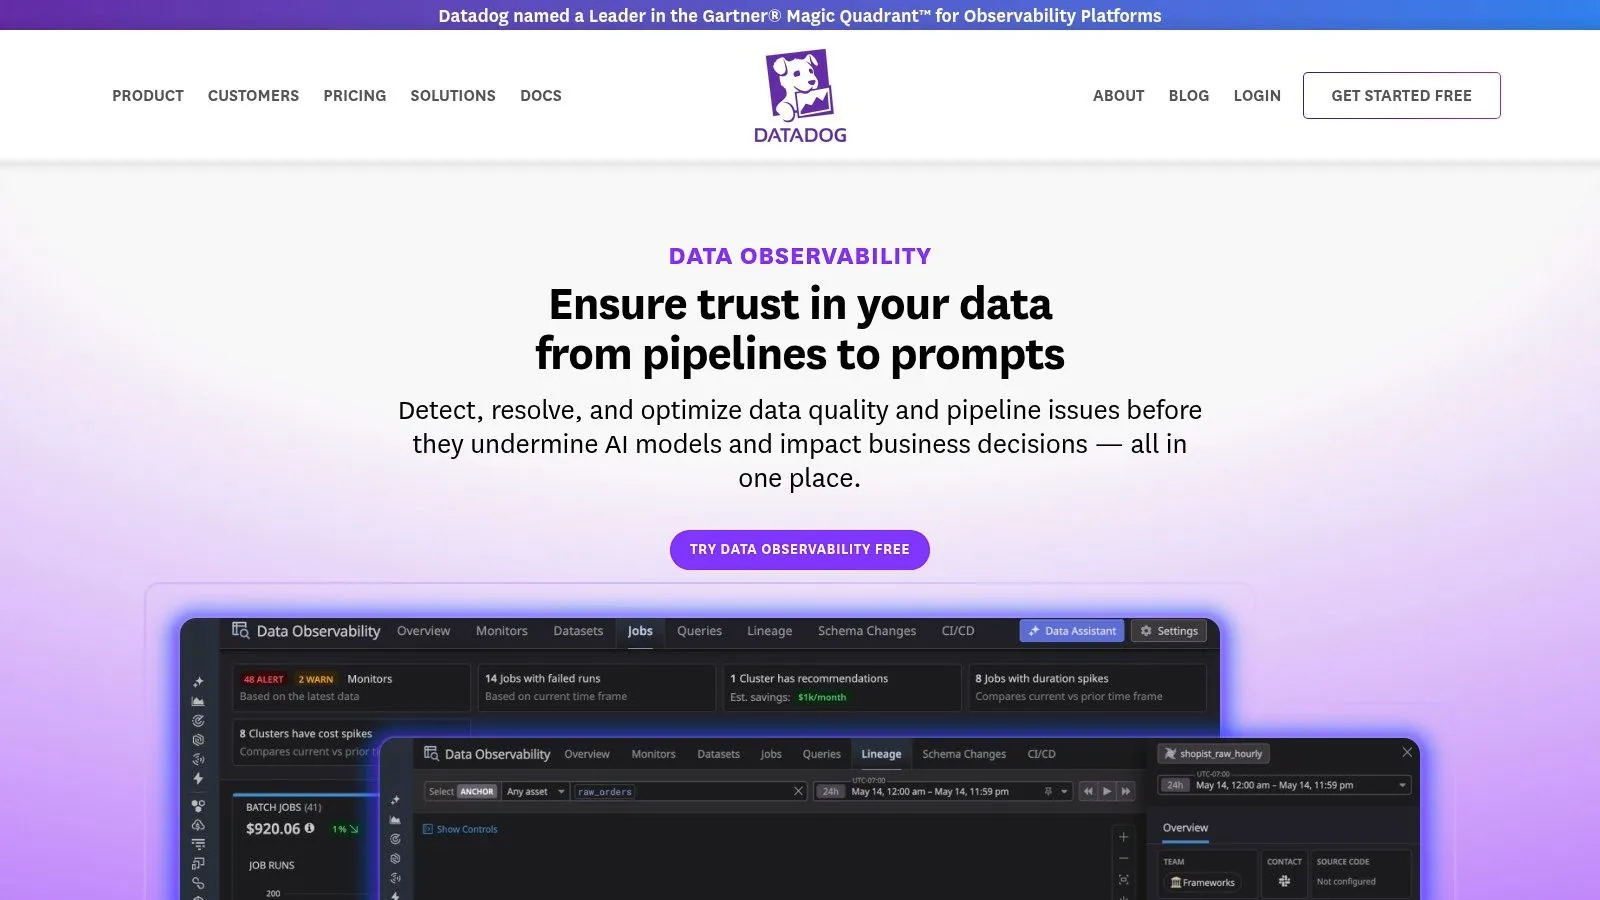
Datadog earns its place when a pipeline break has an infrastructure cause. A retry loop, a saturated worker, a blocked proxy pool, or a deploy that shipped at the wrong hour can be correlated with the job run instead of reconstructed from three tools.
Its edge is context. Job monitoring covers failed and long-running tasks with run history, quality checks track freshness, row counts, nullness, uniqueness and custom SQL, and lineage connects assets to upstream jobs, downstream BI, and streaming paths such as Kafka and RabbitMQ.
The trade-off is metering and scope. Datadog publishes per-table quality monitoring pricing billed annually, while job monitoring is priced separately, and usage meters make the full bill harder to forecast. Quality checks also run aggregate queries in your warehouse, so wider coverage can raise compute spend.
For scraping and ingestion, I would treat it as a strong hub only if you emit per-source extraction success, schema drift, and freshness signals into it. It will not infer a thin pull or wrong field mapping from a landed table. Pair it with disciplined scraper maintenance for long-term use, and it becomes useful when the failure has an operational cause.
2. Monte Carlo
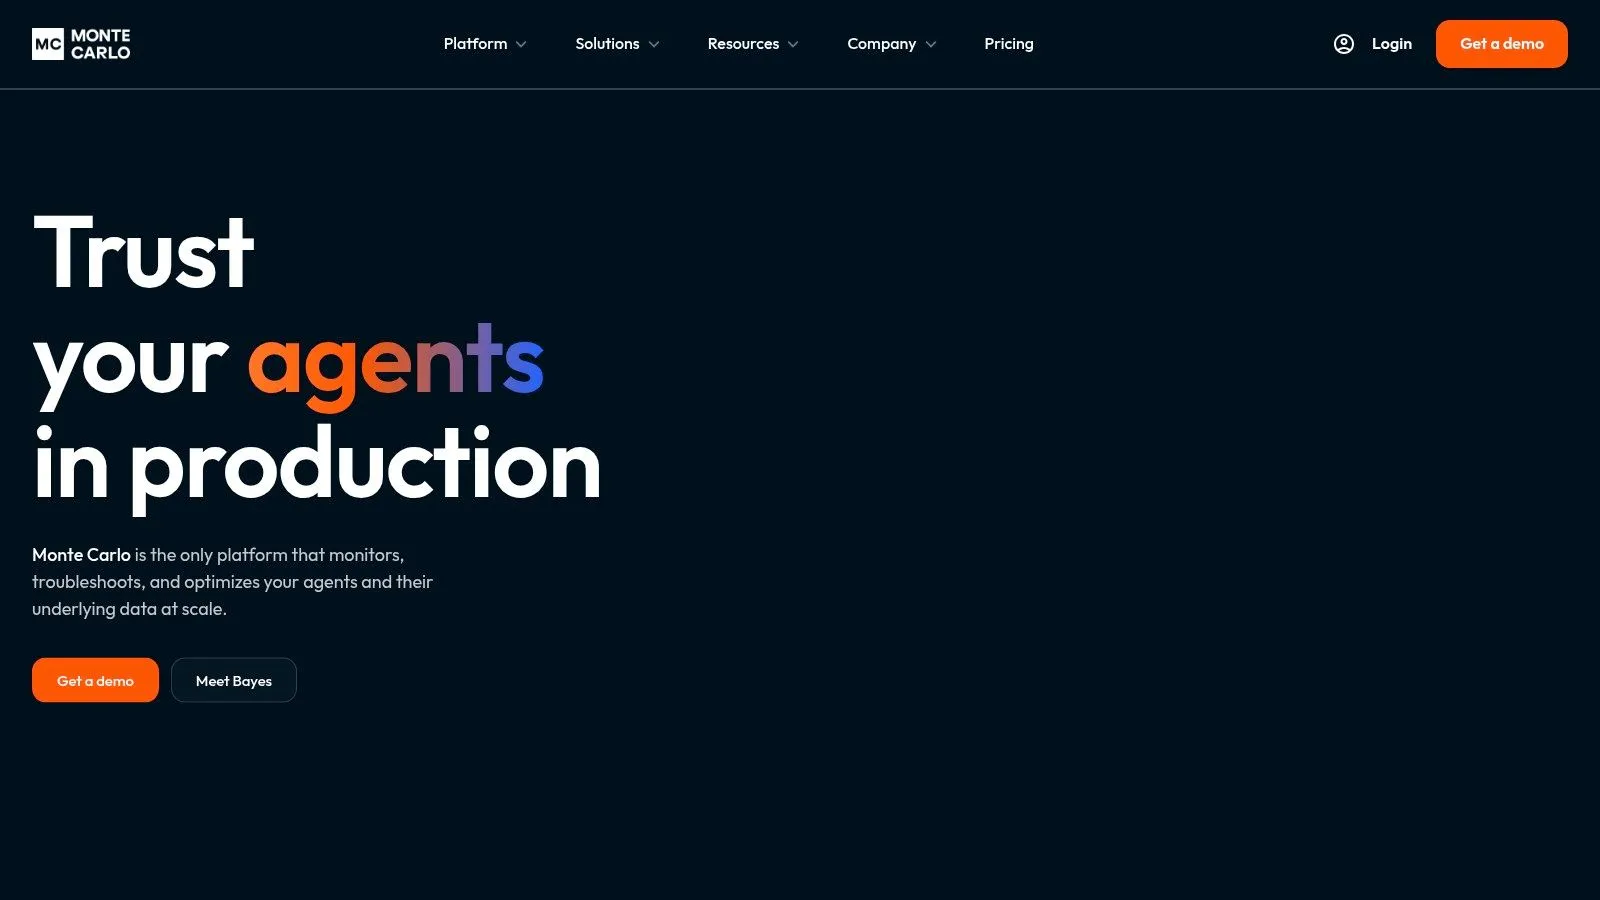
Monte Carlo is a dedicated data observability platform for warehouses, lakes, ETL, and BI. Its value is incident work, not just detection. Field-level lineage and downstream impact analysis show who is affected when a table goes stale, and assignment, severity, and routing workflows keep an incident from becoming an orphaned Slack alert.
Integrations with Airflow, dbt, Databricks, and Azure Data Factory give context beyond the final warehouse table. That’s useful when an ingestion job succeeds but a transformation drops records. You can trace the break upstream instead of arguing about which layer failed.
Practical rule: if a vendor cannot show alert latency on your own connector during a trial, assume the latency is worse than the demo suggests.
The weaknesses are commercial and operational. Pricing is quote based and uses monitor or credit consumption, so you cannot model cost without a sales conversation. Some advanced security, lake, and enterprise features sit in higher tiers. Connector behavior and collection frequency vary, which means alert latency must be confirmed for scraping sources that change hourly.
I recommend Monte Carlo for warehouse first teams with formal incident ownership. Compare it against narrower options in this review of data quality monitoring tools before committing to an enterprise contract.
3. Sifflet
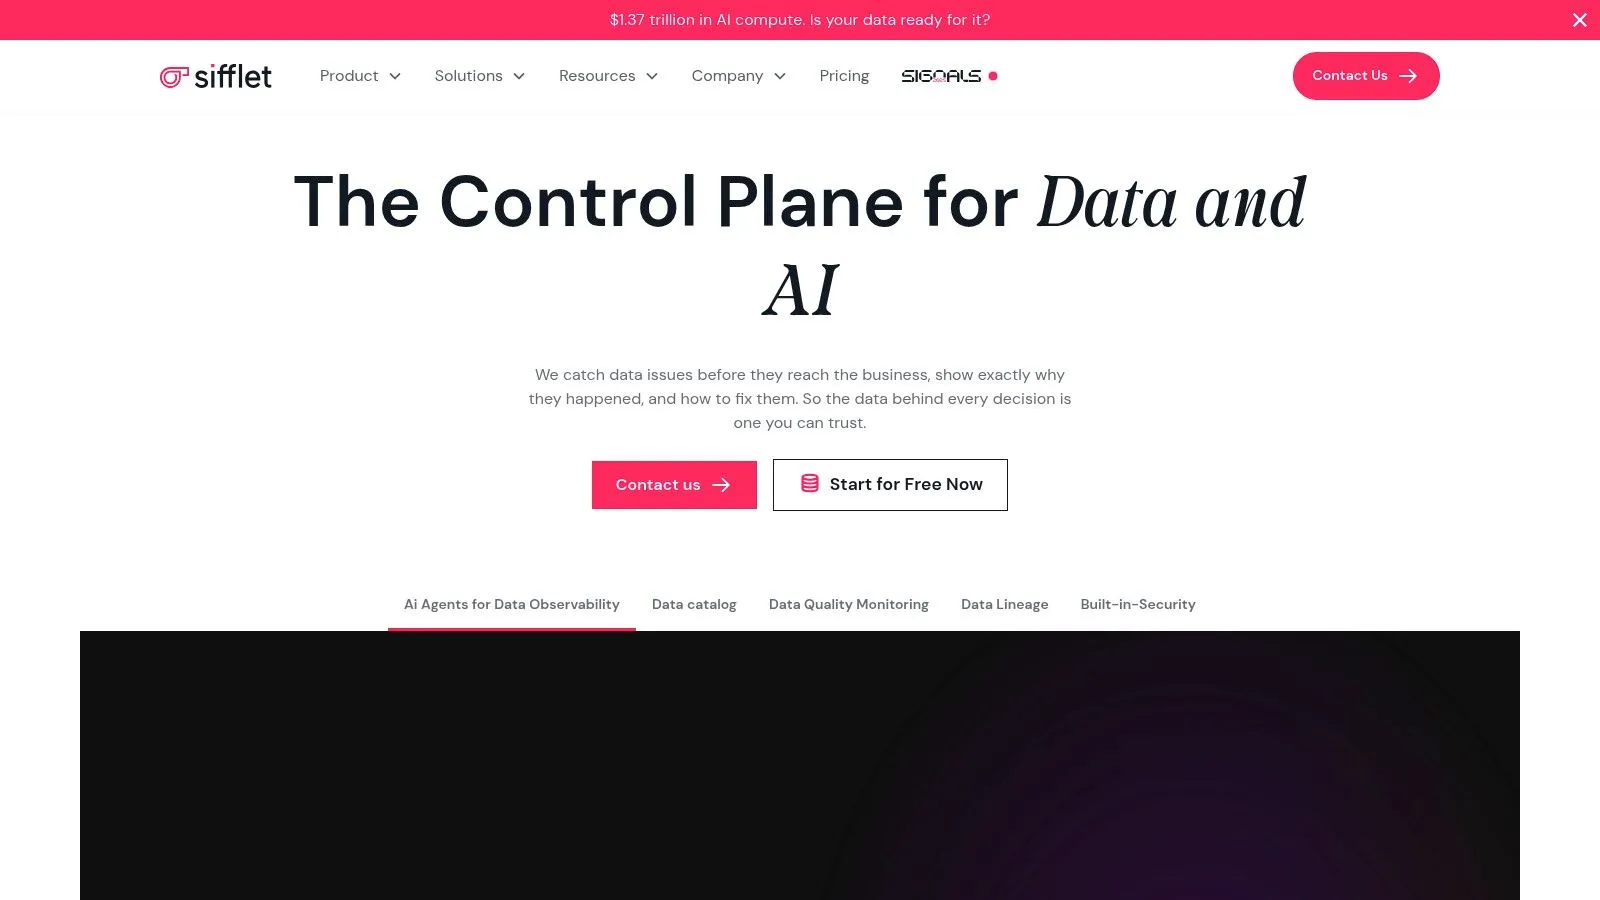
Sifflet organizes monitoring around business facing data products rather than isolated tables. For a team delivering a price feed or a compliance dataset to a named consumer, that framing clarifies ownership. An incident attaches to the product someone depends on, not to an anonymous staging table.
Where Sifflet fits ingestion work
It monitors freshness, schema, volume, and custom metrics and provides pipeline failure alerts for tools including Airflow, dbt, and Fivetran. Lineage and incident views help separate a source outage from a downstream modeling error, which matters when a site changes its markup and the failure shows up three transformations later. Covering pipeline status and data quality in one place reduces the blind spot between orchestration and the warehouse.
Pricing is described in asset capacity tiers, but dollar amounts aren’t published. Capacity tiers without prices give you structure without a budget, so you’ll still need a quote to compare it against Soda or Elementary.
The caution is dashboard latency. Some Sifflet views present snapshots rather than live state, and certain changes can lag before they appear. For daily warehouse reporting that’s tolerable. For a scraper that started returning empty rows at 09.00, a stale view means the bad delivery has already left by the time the dashboard reflects it. Measure that lag during the trial, on your noisiest source, before you sign.
4. Soda
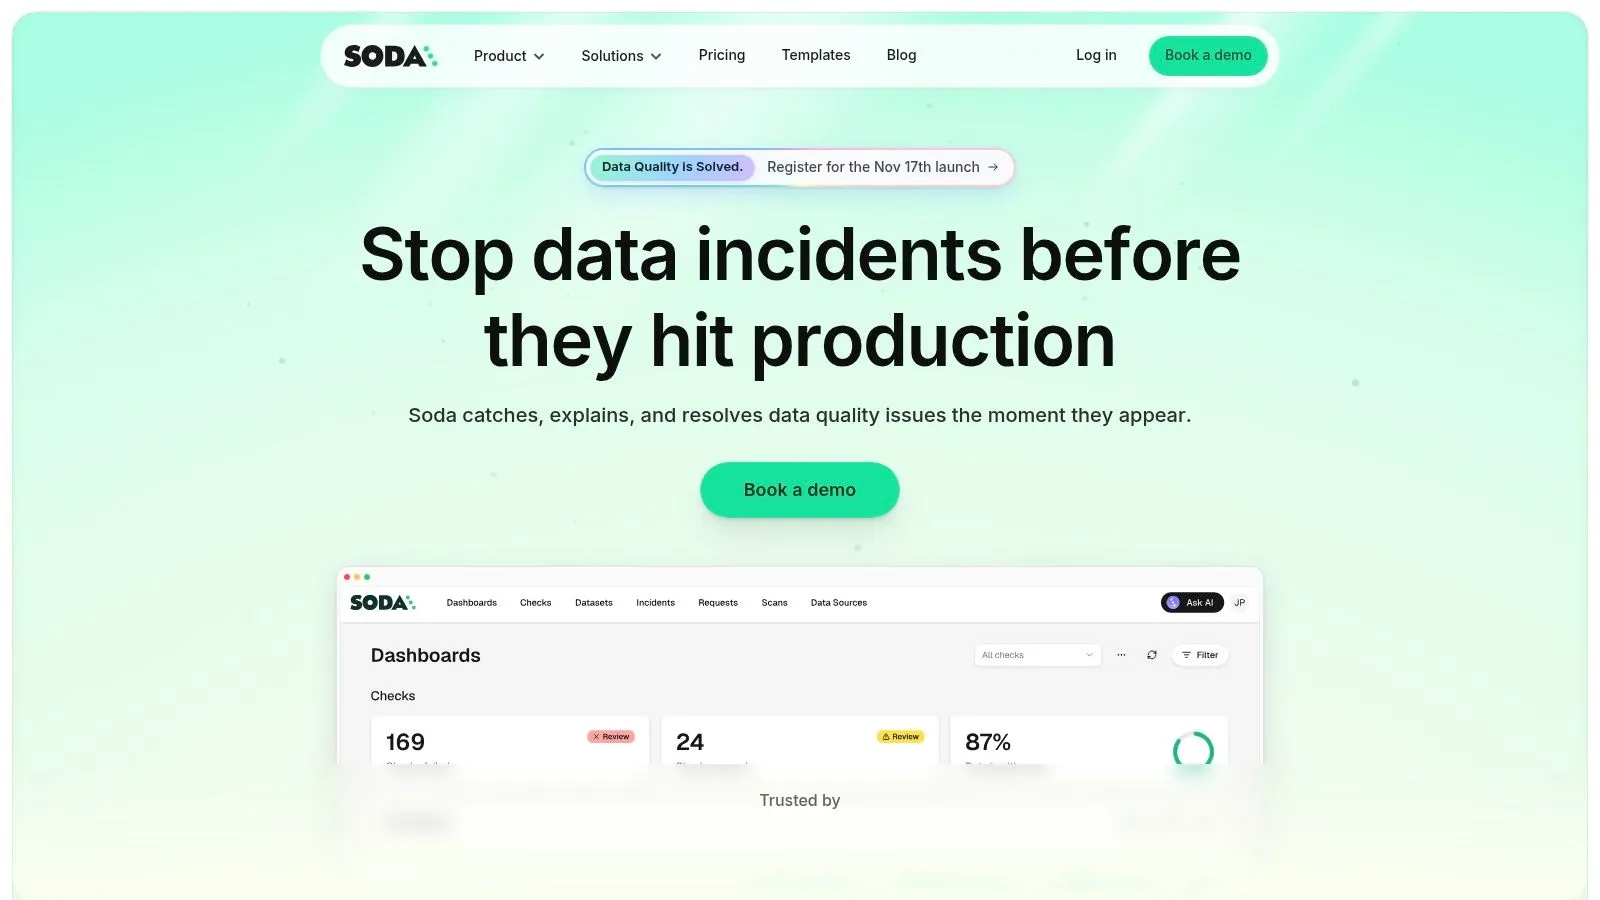
Soda takes the opposite approach to Monte Carlo. Instead of buying an observability platform first, you write YAML based checks and data contracts and run them inside the pipeline. Open source Soda Core supports code first testing, while the commercial platform adds centralized observability, collaboration, no code configuration, governance, and private deployment.
That model suits scraping and ingestion better than many buyers expect. A contract can assert that a field is present, that null rates stay within tolerance, and that row counts don’t collapse after a template change. It can block a bad delivery before it reaches a consumer, which aligns with the discipline described in this ultimate guide to data validation.
- Prevention: pipeline testing catches failures before publication
- Detection: production metrics observability with alerts and ticketing integrations
- Pricing: Free, Team, and custom Enterprise plans support early cost comparison
The cost is engineering effort. Someone must define, maintain, and operate the checks, and a check library rots if nobody owns it. The listed Team plan is also a meaningful fixed monthly cost for a small team. Verify which architecture you’re buying, because current v4 and older v3 documentation describe different product architectures.
I recommend Soda when your engineers will treat checks as code and review them in pull requests.
5. Bigeye
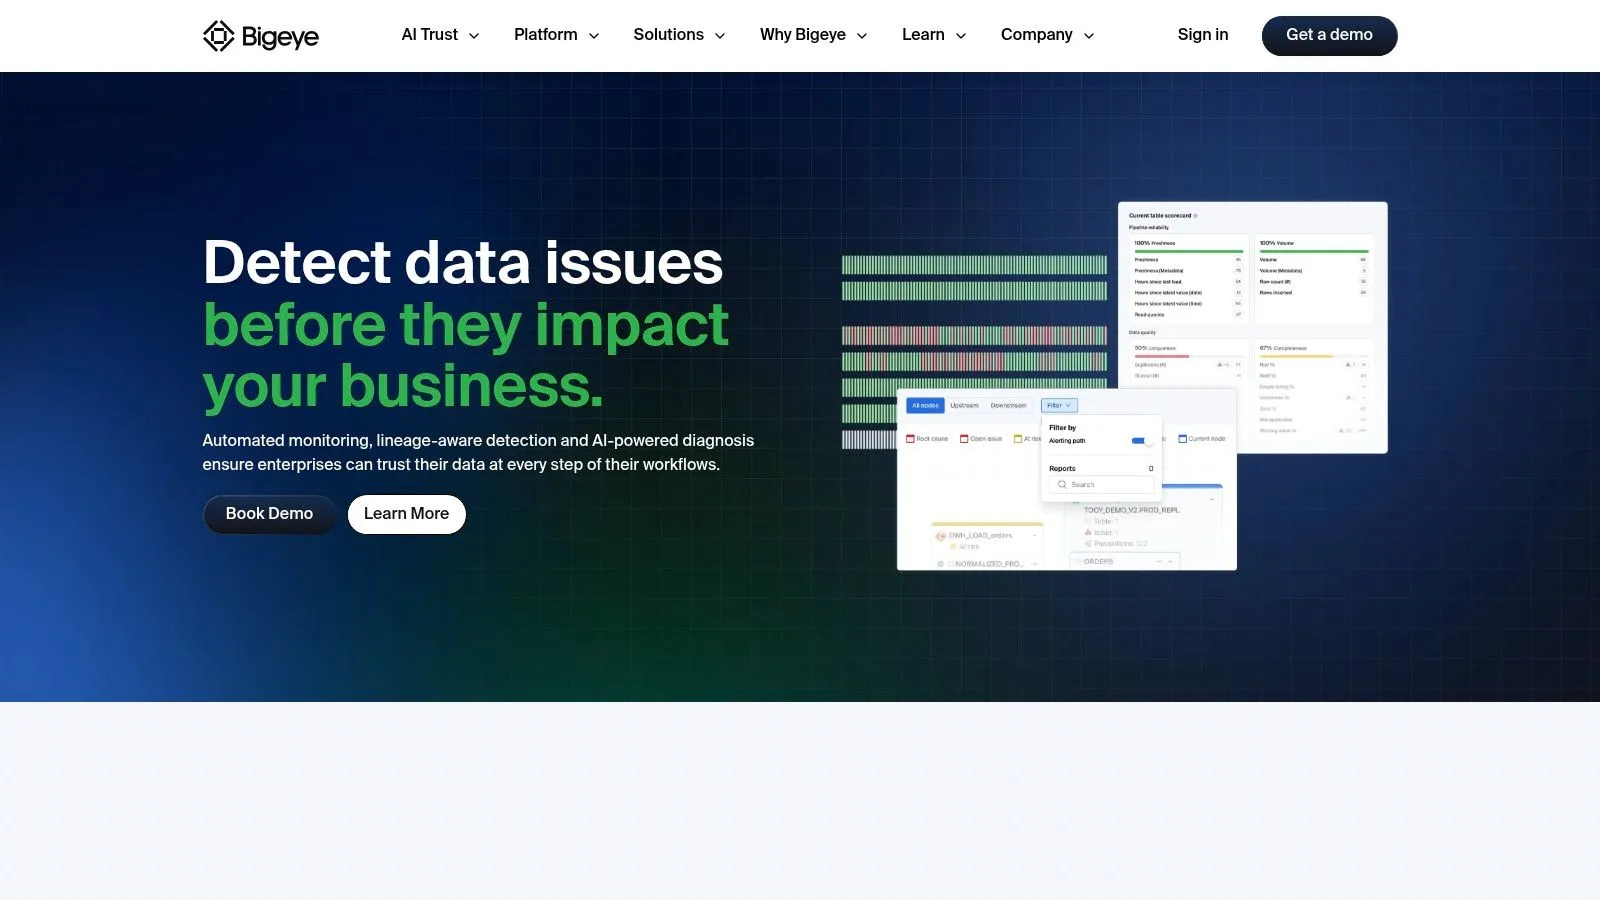
Bigeye is built for enterprises that need automated monitoring across many jobs, tables, and pipelines without hand writing every threshold. Its monitoring adapts as tables, columns, and jobs change, and lineage aware detection helps trace an issue to its origin and downstream dependencies.
Two pieces stand out for larger teams. AI assisted diagnosis suggests fixes or prevention steps rather than leaving an engineer with a red chart. Bigconfig supports version controlled monitoring configuration and dynamic rules, so monitoring can be reviewed and rolled back like application code. That governance matters when hundreds of assets are monitored by several teams.
The trade off is fit. Pricing isn’t published and requires a sales discussion. Enterprise positioning, implementation services, and a product tour signal a considered purchase, not a lightweight trial you finish in an afternoon. Some integrations are marked as coming soon, so connector availability for your exact ingestion stack should be checked in writing.
For a small scraping operation, Bigeye is usually overkill. You’d pay for enterprise incident workflows while your real problem remains a selector that broke on one retailer. For a regulated enterprise delivering many data products, the configuration discipline can justify the weight.
6. Anomalo
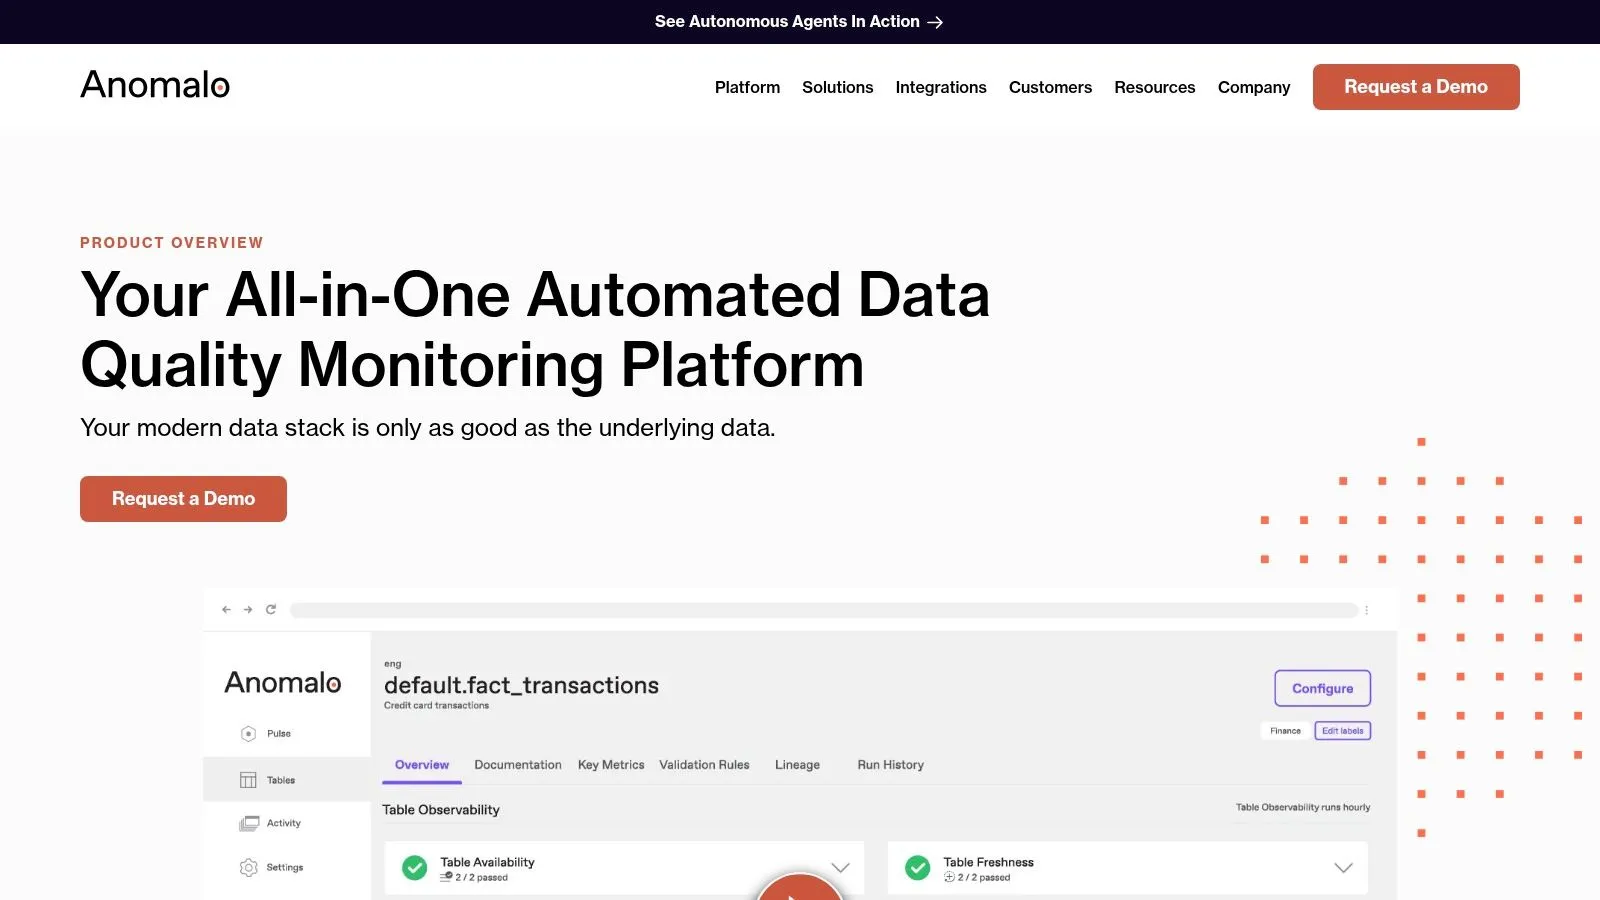
Say a scraper still returns the right number of rows, every field is populated, and the schema hasn’t changed. The prices, however, are now list prices instead of discounted prices because the site moved a promotional block. Fixed thresholds miss that. Anomalo is designed for this class of failure.
It uses unsupervised machine learning to examine table contents and identify missing, anomalous, or unexpected patterns alongside conventional observability checks. No code validation rules and key metric checks let analysts and data stewards add coverage without waiting for an engineer. Visual investigation and false positive suppression matter because anomaly systems lose credibility quickly when they page people for normal seasonality.
A technically healthy pipeline is not the same as a trustworthy data product. Content level checks are what separate the two.
That distinction is supported by survey evidence in a Matillion data and AI readiness survey, which reports that 70% of organizations consider pipeline management somewhat or extremely complex. Complexity is why silent, semantically wrong data survives basic monitoring.
Anomalo doesn’t replace an orchestrator or infrastructure monitoring, and standard pricing isn’t published. Evaluate alert precision and noise in a proof of concept using your most volatile source, not a clean warehouse table.
7. Acceldata Data Observability Cloud
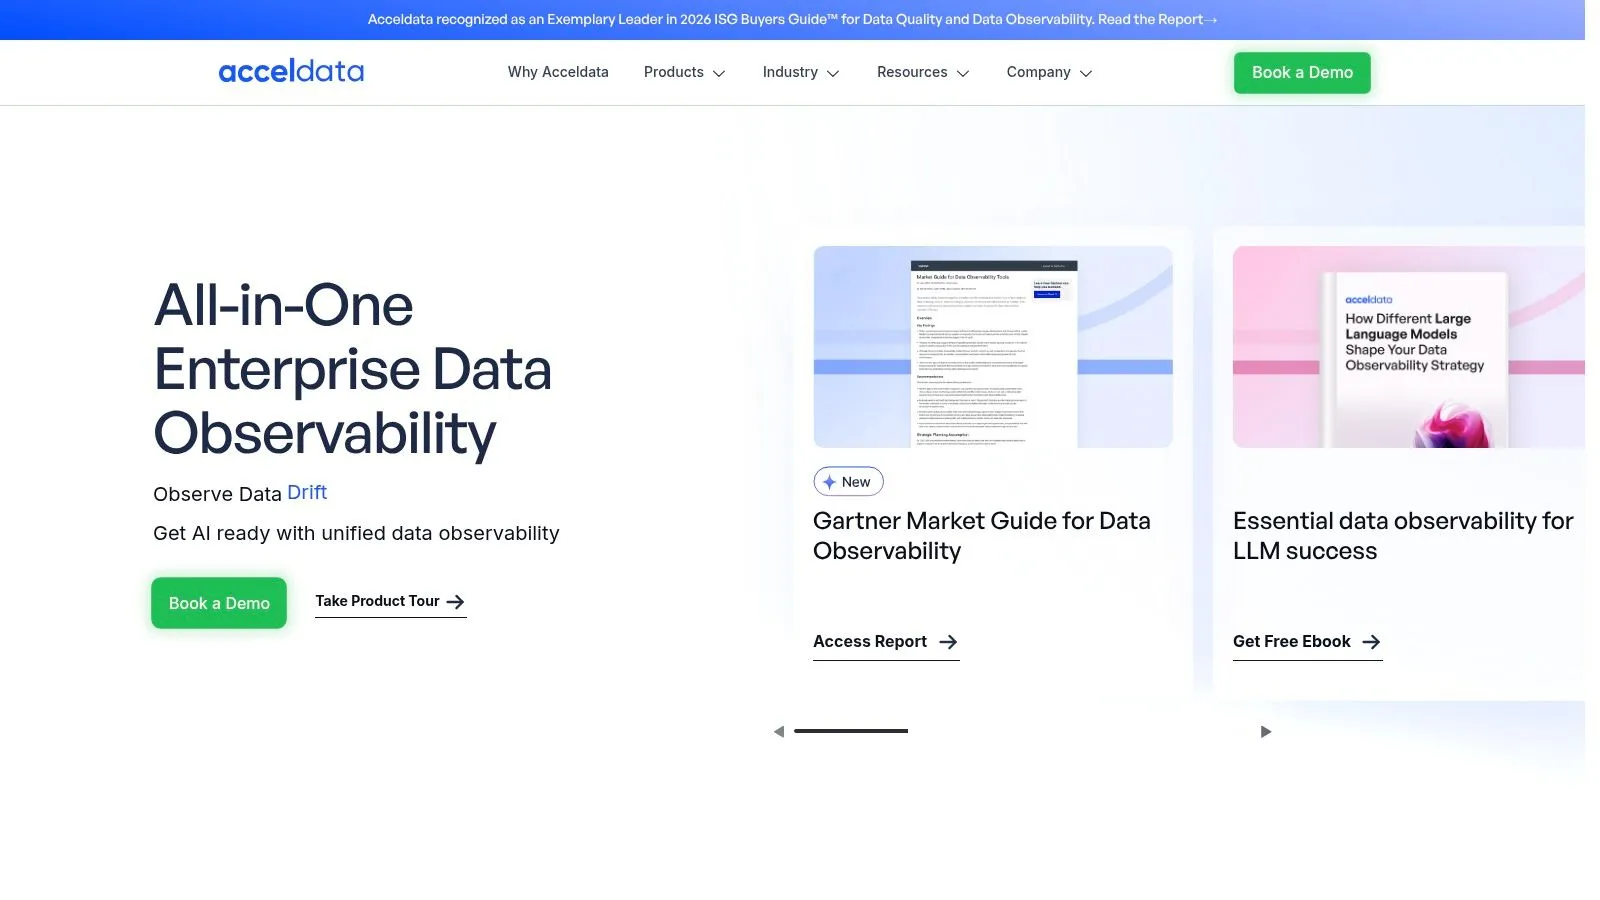
Acceldata Data Observability Cloud spans data quality, pipeline health, infrastructure, users, and data cost. It describes support for structured, unstructured, and streaming data across on premises and cloud environments. That breadth is the reason to consider it, and the reason many teams should not.
Its monitoring covers freshness, profiling, schema drift, anomalies, and data quality, with lineage, alerting, and cost visibility. Pipeline monitoring and reconciliation are listed in the Enterprise plan. Reconciliation is relevant to ingestion, because comparing source counts against delivered counts catches partial extraction that a freshness check passes.
Hybrid and on premises support also separates Acceldata from warehouse native tools. If part of your pipeline runs outside a cloud warehouse for compliance or cost reasons, that coverage is difficult to replicate with a narrower product. A 30 day trial gives you room to test it.
The commercial structure needs early scrutiny. Standard pricing isn’t published, and pipeline monitoring being an Enterprise feature means the capability you came for may not exist in the tier you budgeted for. Confirm plan fit before investing in integration work.
I recommend Acceldata for hybrid estates with cost and infrastructure concerns. Teams that only need scheduled job alerts will carry platform weight they never use.
8. Elementary
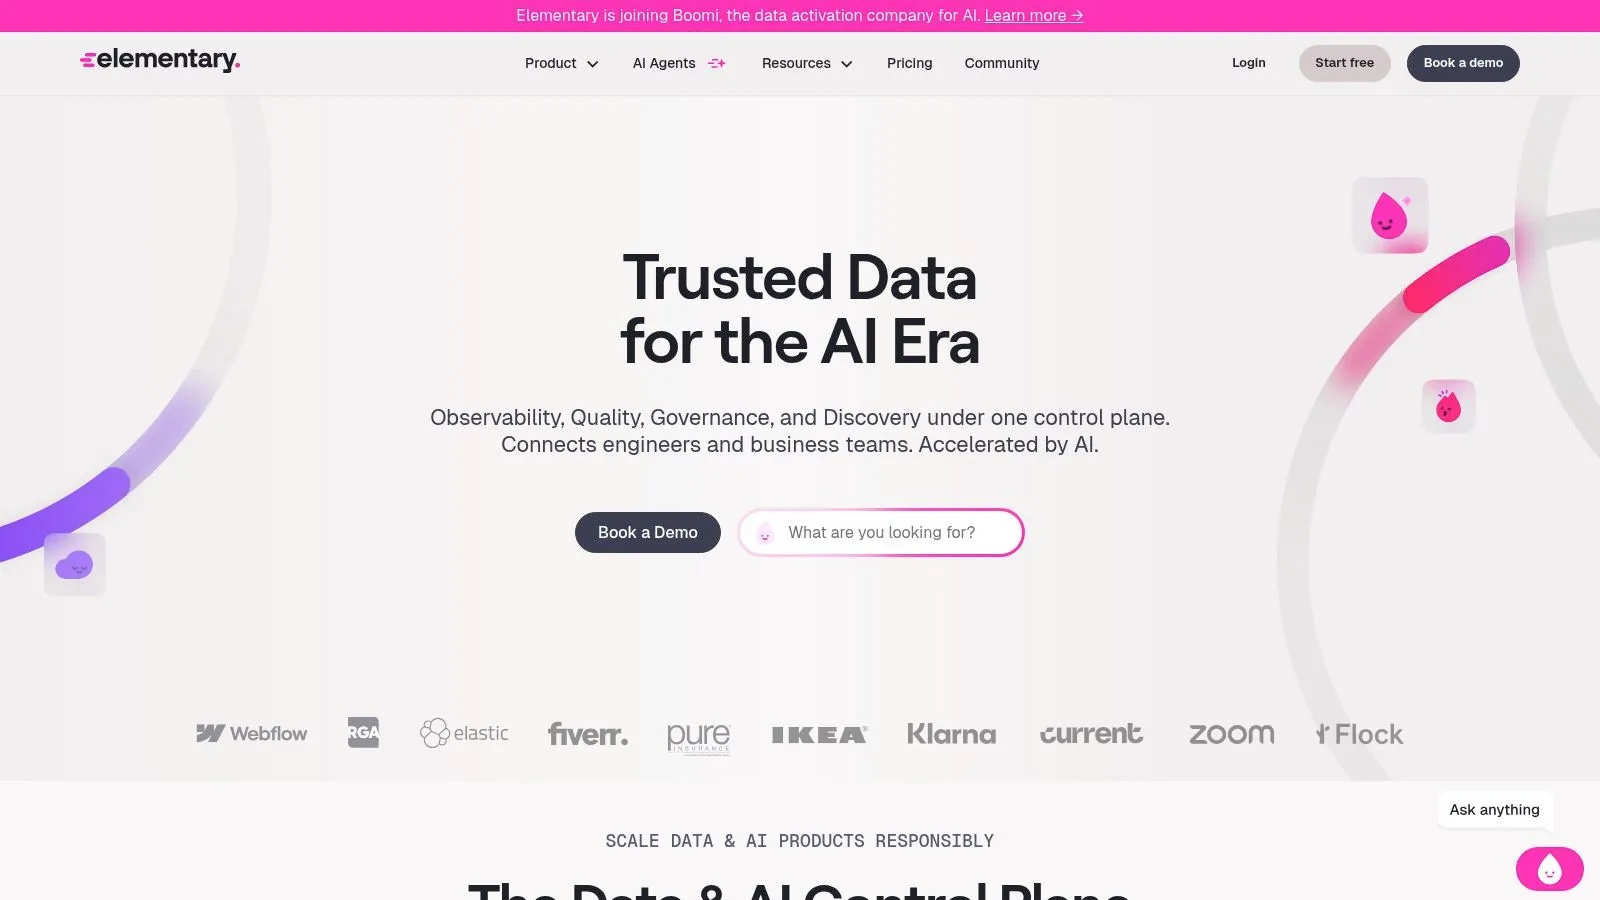
Elementary is the clearest example of a tool that’s excellent inside its boundary and incomplete outside it. It’s dbt native, with an open source CLI and dbt package for monitoring tests, model runs, and data quality. Automated freshness, volume, and schema monitors sit where dbt teams already work.
That placement has real advantages. Monitoring configuration fits code review and version control, so a threshold change is reviewed like a model change. The self hosted community option gives dbt teams a lower cost starting point than any enterprise platform in this list. Elementary Cloud adds column level lineage, a catalog, and incident workflows, and the vendor states that Cloud reads logs, results, and metadata rather than raw data. A 30 day Cloud trial is available, though Cloud prices aren’t publicly listed.
The ingestion gap
Elementary sees what dbt sees. If a scraper fails before data reaches the warehouse, or a non dbt ingestion job writes partial files, that event sits outside its natural view. Non dbt job and ingestion coverage should be verified before you treat it as an end to end monitor.
Use Elementary when dbt is the center of transformation and you accept a separate alert for extraction. Don’t ask it to watch sources it was never built to watch.
9. Astronomer Astro Observe
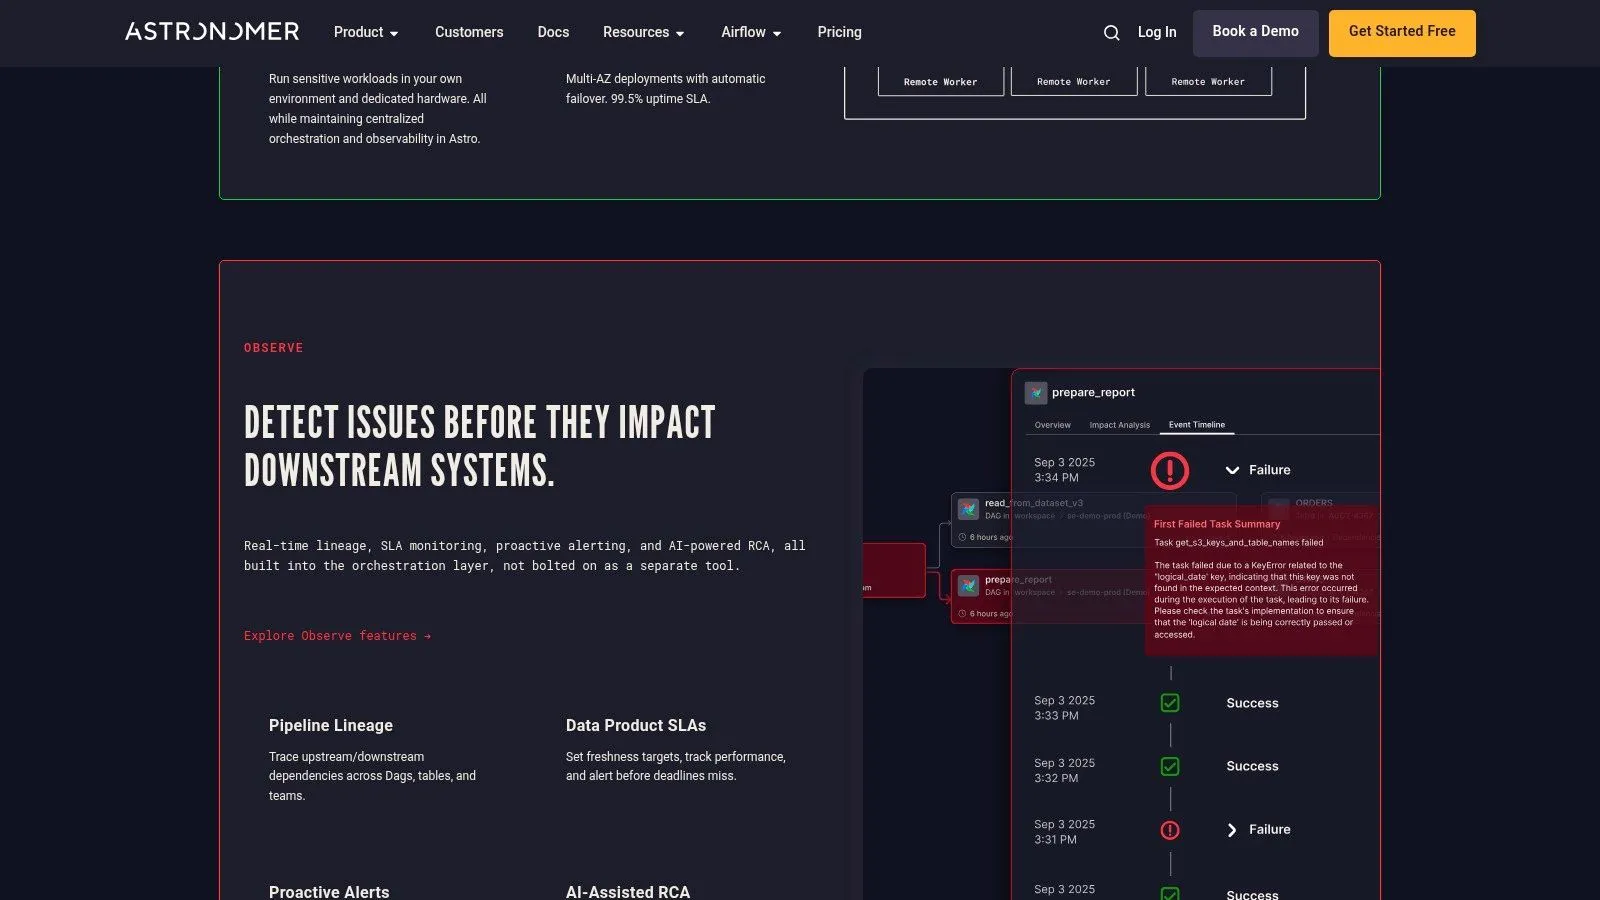
Astronomer Astro Observe connects Airflow execution to data assets and business facing data products. That lineage is the point. Instead of reporting that a task failed, it shows which asset went stale and which product missed its SLA.
The historical context explains why this layer exists. The Apache Airflow project description notes that Airflow was created at Airbnb in October 2014 and became an Apache top level project in January 2019. Orchestration became infrastructure, and observability followed it.
- Freshness and timeliness SLAs: alerts tied to assets rather than tasks alone
- Historical task performance: related log investigation for recurring slowdowns
- AI generated log summaries: faster identification of failures and downstream impact
For scraping pipelines scheduled in Airflow, this is a natural fit. You can set an SLA per target and see which source is drifting before it breaches. That provenance trail also supports audit work, as explained in this overview of what data provenance is.
The limitation is scope. Astro Observe is Airflow centric, and total spend depends on deployment and worker compute, with Observe potentially adding a charge. Teams on other orchestrators should compare vendor neutral alternatives.
10. IBM watsonx.data integration Data Observability
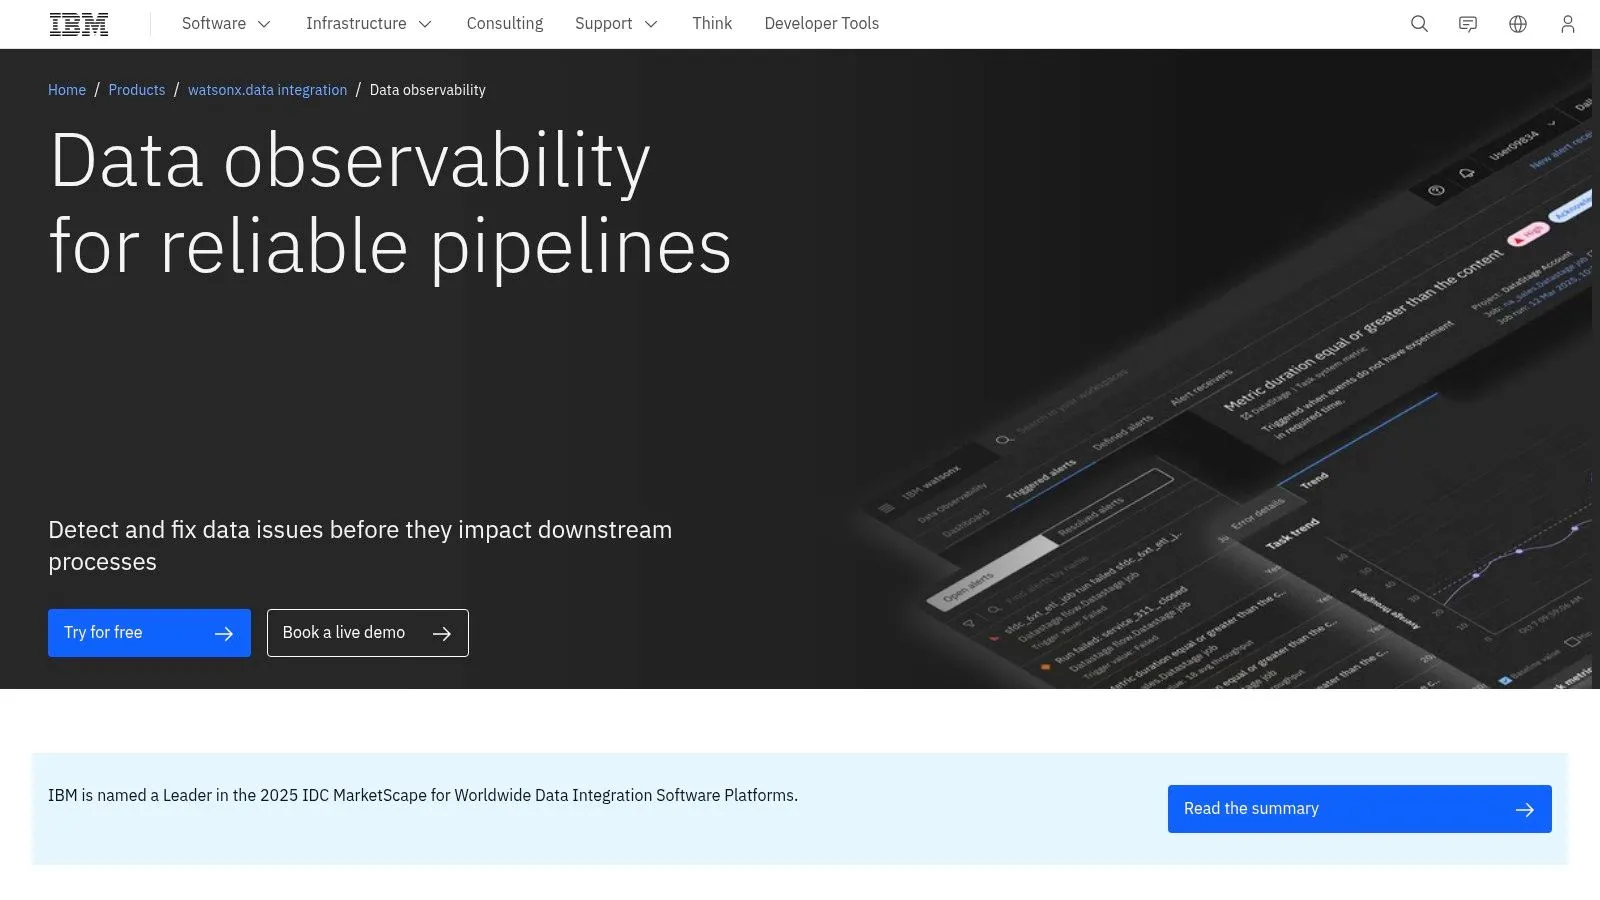
IBM watsonx.data integration Data Observability places observability inside a broader data integration product. That suits organizations already buying IBM integration and governance capabilities, and it’s a heavier commitment for everyone else.
Functionally, it covers the essentials competently. It offers pipeline and process duration thresholds, data quality and input and output count monitoring, freshness rules, pipeline performance history, dependency context, and root cause analysis. Alert routing to Slack, PagerDuty, and email meets the standard operational requirement. Input and output count monitoring is particularly relevant to ingestion because a mismatch is often the first sign of partial extraction.
SaaS and self managed deployment options are described for the broader product, and a 30 day trial is available through the IBM Cloud catalog. Published Resource Unit pricing helps with an initial assessment, but Resource Unit consumption must be estimated against your workload and selected features. Capabilities included also depend on the specific deployment and plan.
Governance heavy organizations may value that breadth, a theme developed in this discussion of data governance by design. If monitoring is all you need, a narrower tool will be cheaper to buy, implement, and eventually replace.
Data Pipeline Monitoring Tools at a Glance
| Tool | Pricing transparency | Pipeline job monitoring | Lineage & root-cause | Best fit |
|---|---|---|---|---|
| Datadog Data Observability | Partial: quality monitoring starts at $16 per table monthly; job monitoring priced separately | Failed and long-running jobs, run history, and failure context | Asset lineage and operational signals help trace impact and causes | Teams wanting data observability alongside infrastructure and application monitoring |
| Monte Carlo | Quote-based; uses monitor or credit consumption | Pipeline integrations provide job context | Field-level lineage, downstream impact, and incident triage | Teams needing dedicated observability and investigation across warehouses, ETL, and BI |
| Sifflet | Capacity-based tiers; prices not published | Pipeline failure alerts and status context | Lineage and incident views for cause and downstream impact | Teams seeking quality and pipeline monitoring organized around data products |
| Soda | Free, Team, and custom Enterprise plans; pricing published | Pipeline testing and production metrics observability | No lineage details specified; alerts support issue response | Engineering teams wanting code-first checks and production monitoring |
| Bigeye | Sales-based; prices not published | Monitors jobs, tables, and pipelines | Lineage-aware detection and AI-assisted diagnosis | Enterprise teams seeking automated monitoring and managed rules |
| Anomalo | Prices not published | Not a full job or infrastructure monitoring system | Visual investigation and root-cause analysis; no lineage details specified | Teams focused on automated data-quality anomaly detection |
| Acceldata Data Observability Cloud | Standard pricing not published; 30-day trial available | Pipeline monitoring and reconciliation in Enterprise plan | Lineage and alerting; root-cause details not specified | Teams needing broad data, pipeline, infrastructure, and cost visibility |
| Elementary | Open-source option; Cloud prices not published | Monitors dbt pipelines, tests, and model runs | Cloud includes column-level lineage and incident workflows | dbt-centered teams seeking code-based monitoring |
| Astronomer Astro Observe | Astro pricing published; total cost depends on deployment and compute | Airflow pipeline health, task history, and freshness SLAs | Pipeline and asset lineage, log investigation, and AI-assisted root-cause analysis | Teams running production Airflow |
| IBM watsonx.data integration, Data Observability | Resource Unit pricing published; production cost depends on plan and workload | Pipeline monitoring, run history, and duration thresholds | Dependency context and root-cause analysis | Organizations seeking observability with broader data-integration capabilities |
Choosing a Monitor or Handing the Pipeline to Someone Else
Start with your stack, not a feature matrix. Airflow-centric teams should evaluate Astro Observe and IBM first. dbt-native teams get the fastest value from Elementary or Soda. Warehouse-first teams with formal incident ownership should compare Monte Carlo, Bigeye, and Anomalo, while teams already standardized on Datadog should test whether its correlation saves enough investigation time to justify another meter.
The market direction still tells you where to scrutinize. Observability is becoming part of delivery architecture rather than an optional dashboard, and vendors now publicize milestones like DQLabs being named in the Gartner Market Guide for Data Observability Tools as evidence the category has matured. For buyers, the practical consequence is that integration quality and exportable metrics now matter as much as alerting.
Demand proof on the metrics that predict failure in ingestion work. The open PipeBench benchmarking framework measures throughput and output loss under repeatable conditions, which is the right instinct for a trial. Apply it directly. Track records per second, end-to-end latency, per-stage latency, retry rate, duplicate rate, missing-field rate, and delivery success, and set separate SLOs for technical delivery and data correctness.
- Run a two-week proof of concept: use your noisiest pipeline, not your cleanest warehouse table
- Measure alert latency: record the time from a broken source to a routed, owned alert
- Inject a silent failure: rename a field, halve the volume, and duplicate records deliberately
- Model total cost: include warehouse query spend, monitored asset growth, and tier upgrades
The deeper question is whether detection is your actual problem. For web scraping and ingestion pipelines, remediation usually is. The category was built to watch warehouse tables, dbt models, and orchestrated jobs, so it catches the symptom, a feed that stalls or a null rate that spikes, while the cause sits upstream in a site that changed its layout. An alert tells you a site changed. Someone still has to inspect the new markup, re-tune the extractor, validate the output, and redeploy before the next scheduled delivery. If that someone is a product engineer pulled off roadmap work, monitoring has only made the interruption faster and better documented. MR2 Solutions’ guidance on managed services operations frames that follow-through as an ongoing responsibility rather than a tooling purchase.
That is the case for a managed model. In a managed engagement, per-target monitoring flags a drop in extraction success rate within the first run after a site change, and the alert routes to the operator running the pipeline rather than to the client. Schema drift triggers re-tuning within 48 hours at no additional charge, included in every recurring engagement, and the provider absorbs rotating proxies, browser fleet management, CAPTCHA resolution, retries, and schema versioning as part of the infrastructure. Automated QA gates every recurring delivery, checking schema conformance, null-rate thresholds, duplicate detection, and row-count deltas against a historical baseline, with human review of anything outside tolerance before delivery.
Buy a monitor when you have engineers who want to own pipelines and need better signals. Hand the pipeline to a managed provider when the signals are fine and the repair work is the bottleneck. Either way, run the two-week proof of concept first. A tool that cannot catch a deliberately broken source in a trial will not catch an accidental one in production.
If your team is spending engineering time repairing extractors instead of using the data, WebscrapingHQ builds and operates managed scraping pipelines with per-target monitoring, automated QA, and re-tuning included on recurring deliveries. Tell us which sources and schemas you need, and we’ll scope feasibility, delivery format, and schedule before you commit to a build.
Want this done for you?
Send us the URLs. We'll quote it in 24 hours.
Paste the URL(s) you want scraped. We'll reply within 24 hours with a feasibility check and a ballpark quote.